在geom_vline中添加图例

28

我知道这个问题以前已经被问过,但解决方案似乎对我不起作用。

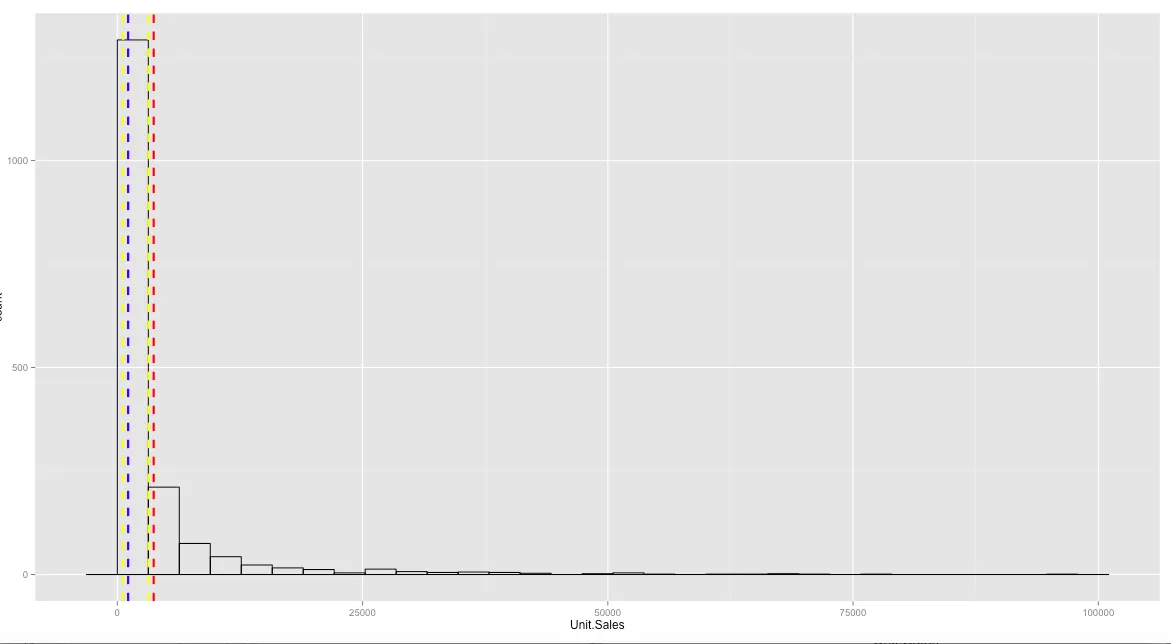
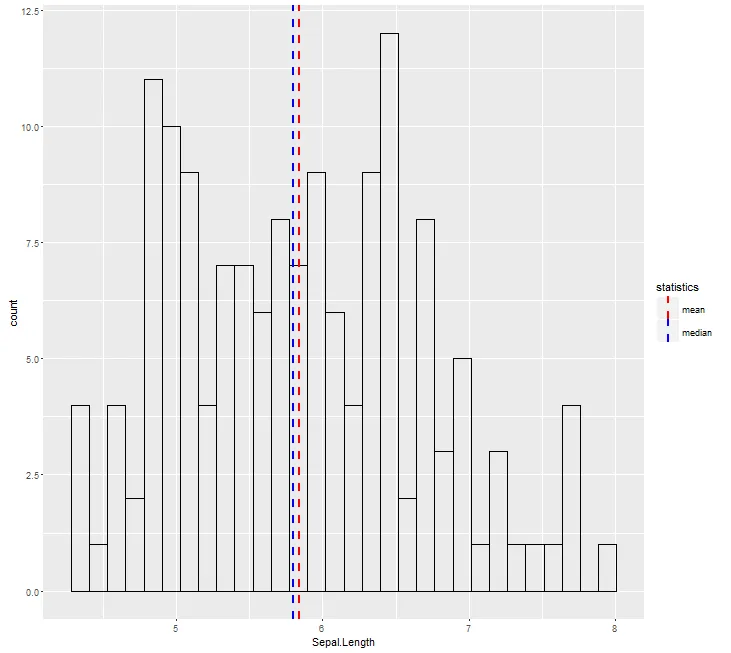
我想做的是在直方图上使用不同颜色表示我的中位数、均值、上下四分位数,然后添加一个图例到图表中。目前我已经尝试使用 scale_color_manualscale_color_identity 给图例加上颜色,但似乎都无法生效。

quantile_1 <- quantile(sf$Unit.Sales, prob = 0.25)
quantile_2 <- quantile(sf$Unit.Sales, prob = 0.75)

ggplot(aes(x = Unit.Sales), data = sf) + 
  geom_histogram(color = 'black', fill = NA) + 
  geom_vline(aes(xintercept=median(Unit.Sales)),
            color="blue", linetype="dashed", size=1) + 
  geom_vline(aes(xintercept=mean(Unit.Sales)),
            color="red", linetype="dashed", size=1) +
  geom_vline(aes(xintercept=quantile_1), color="yellow", linetype="dashed", size=1)

结果图

1个回答

51

你需要在 aes 内部映射颜色:

ggplot(aes(x = Sepal.Length), data = iris) + 
  geom_histogram(color = 'black', fill = NA) + 
  geom_vline(aes(xintercept=median(iris$Sepal.Length),
                 color="median"), linetype="dashed",
             size=1) +
  geom_vline(aes(xintercept=mean(iris$Sepal.Length),
                 color="mean"), linetype="dashed",
             size=1) +
  scale_color_manual(name = "statistics", values = c(median = "blue", mean = "red"))

resulting plot


1
如果这对你不起作用:对我来说,通过在其中一个geom_vline命令中添加“show_guide=TRUE”可以解决问题。 - panuffel
2
即使我将“show_guide”更改为“show.legend”(当R发出警告时)并将其添加到我的每个'geom_vlines'中,它对我仍然没有起作用。 - Nate Lockwood
4
你可能已经将颜色写在了 aes() 的外部。不需要使用 "show_guide" 或者 "show.legend"。你的 "color=" 需要放在 "aes()" 内部。 - TeYaP

网页内容由stack overflow 提供, 点击上面的
可以查看英文原文,
原文链接