几年前,我已经尝试将实时的 `matplotlib` 绘图嵌入到一个 `PyQt5` 图形用户界面中。实时绘图显示来自传感器、某些过程等数据流的实时数据。我已经把它做好了,你可以在这里阅读相关的帖子:
现在我需要再次实现同样的功能。我记得我的先前方法可行,但无法跟上快速的数据流。我在互联网上找到了一些示例代码,我想向您展示其中几个。其中一个明显比另一个快,但我不知道为什么。我想获得更多信息。我相信深入的理解将使我与 `PyQt5` 和 `matplotlib` 的交互更加高效。
https://matplotlib.org/3.1.1/gallery/user_interfaces/embedding_in_qt_sgskip.html
这篇文章来自于官方的 `matplotlib` 网站,介绍了如何将一个 matplotlib 图形嵌入到一个 `PyQt5` 窗口中。
我对示例代码进行了一些小的调整,但基本原理仍然相同。请将以下代码复制粘贴到 Python 文件中并运行:
您应该看到以下窗口: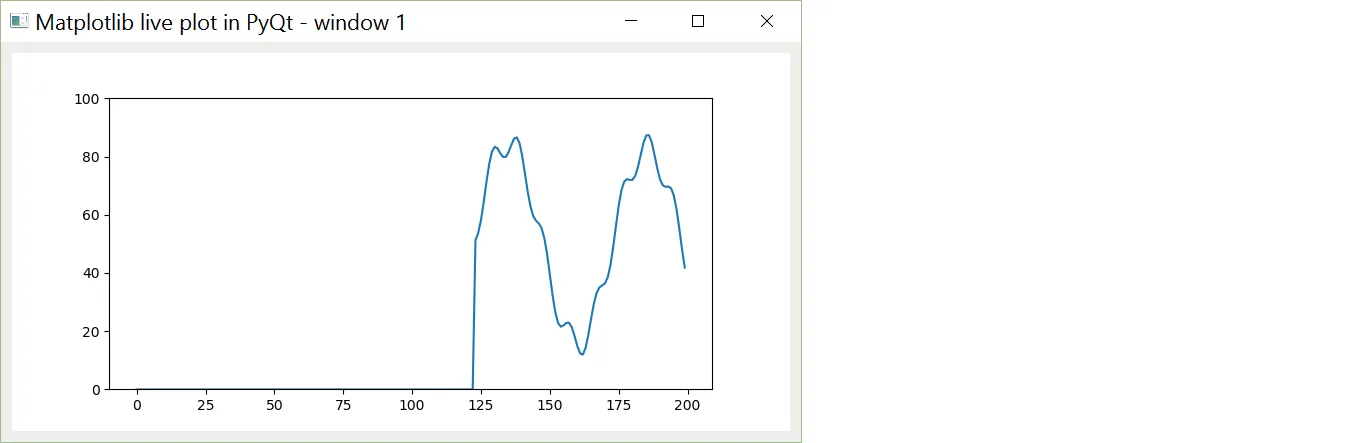 第二个示例:
我在这里找到了另一个实时matplotlib图形的例子:
https://learn.sparkfun.com/tutorials/graph-sensor-data-with-python-and-matplotlib/speeding-up-the-plot-animation
然而,作者没有使用PyQt5来嵌入他的实时绘图。因此,我稍微修改了一下代码,以在PyQt5窗口中获得绘图:
结果得到的动态图是完全相同的。但是,如果你开始使用
3. 问题
我有几个问题想要向您提出:
-
或者这样导入:
两种方法都一样好。是否有理由优先选择其中一种?
-
或者这样导入:
但是我已经弄清楚了为什么。
- 为什么第二个例子比第一个例子快那么多?老实说,这让我感到惊讶。第一个示例基于官方matplotlib网站上的一个网页。我期望那个更好。
- 您有任何建议可以使第二个示例运行得更快吗?
4. 编辑
根据这个网页:
https://bastibe.de/2013-05-30-speeding-up-matplotlib.html
我修改了第一个示例以增加其速度。请查看以下代码:
结果非常惊人。这些修改使得第一个示例的速度显著提高!然而,我不知道这是否使得第一个示例现在和第二个示例的速度相同。它们肯定接近。有人知道哪个更快吗?
此外,我注意到左侧缺少一条竖线,顶部缺少一条横线: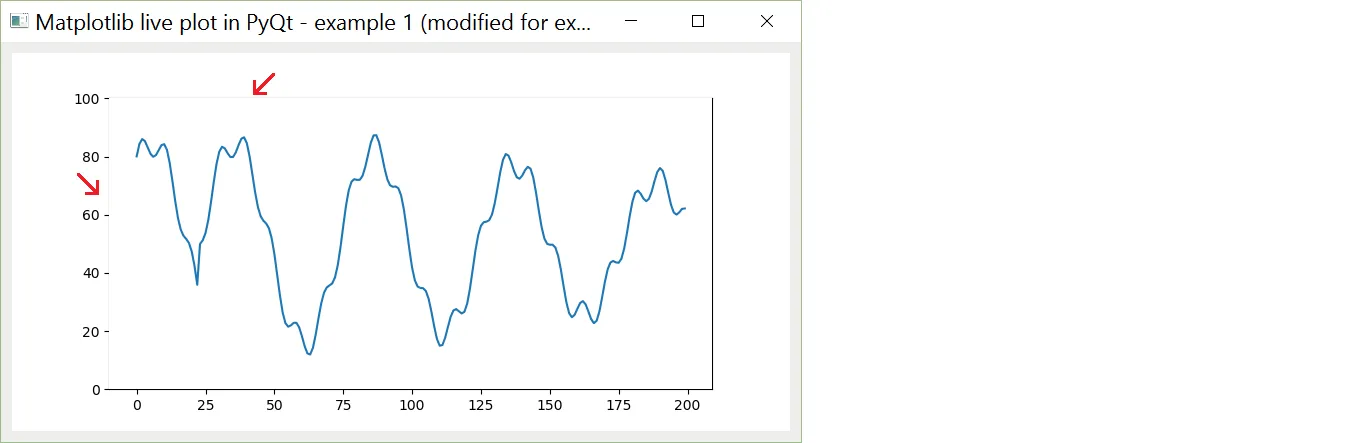 这不是什么大问题,但我只是想知道为什么会这样。
1. 第一个示例
此示例基于以下文章:https://matplotlib.org/3.1.1/gallery/user_interfaces/embedding_in_qt_sgskip.html
这篇文章来自于官方的 `matplotlib` 网站,介绍了如何将一个 matplotlib 图形嵌入到一个 `PyQt5` 窗口中。
我对示例代码进行了一些小的调整,但基本原理仍然相同。请将以下代码复制粘贴到 Python 文件中并运行:
#####################################################################################
#                                                                                   #
#                PLOT A LIVE GRAPH IN A PYQT WINDOW                                 #
#                EXAMPLE 1                                                          #
#               ------------------------------------                                #
# This code is inspired on:                                                         #
# https://matplotlib.org/3.1.1/gallery/user_interfaces/embedding_in_qt_sgskip.html  #
#                                                                                   #
#####################################################################################

from __future__ import annotations
from typing import *
import sys
import os
from matplotlib.backends.qt_compat import QtCore, QtWidgets
# from PyQt5 import QtWidgets, QtCore
from matplotlib.backends.backend_qt5agg import FigureCanvas
# from matplotlib.backends.backend_qt5agg import FigureCanvasQTAgg as FigureCanvas
import matplotlib as mpl
import numpy as np

class ApplicationWindow(QtWidgets.QMainWindow):
    '''
    The PyQt5 main window.

    '''
    def __init__(self):
        super().__init__()
        # 1. Window settings
        self.setGeometry(300, 300, 800, 400)
        self.setWindowTitle("Matplotlib live plot in PyQt - example 1")
        self.frm = QtWidgets.QFrame(self)
        self.frm.setStyleSheet("QWidget { background-color: #eeeeec; }")
        self.lyt = QtWidgets.QVBoxLayout()
        self.frm.setLayout(self.lyt)
        self.setCentralWidget(self.frm)

        # 2. Place the matplotlib figure
        self.myFig = MyFigureCanvas(x_len=200, y_range=[0, 100], interval=20)
        self.lyt.addWidget(self.myFig)

        # 3. Show
        self.show()
        return

class MyFigureCanvas(FigureCanvas):
    '''
    This is the FigureCanvas in which the live plot is drawn.

    '''
    def __init__(self, x_len:int, y_range:List, interval:int) -> None:
        '''
        :param x_len:       The nr of data points shown in one plot.
        :param y_range:     Range on y-axis.
        :param interval:    Get a new datapoint every .. milliseconds.

        '''
        super().__init__(mpl.figure.Figure())
        # Range settings
        self._x_len_ = x_len
        self._y_range_ = y_range

        # Store two lists _x_ and _y_
        self._x_ = list(range(0, x_len))
        self._y_ = [0] * x_len

        # Store a figure ax
        self._ax_ = self.figure.subplots()

        # Initiate the timer
        self._timer_ = self.new_timer(interval, [(self._update_canvas_, (), {})])
        self._timer_.start()
        return

    def _update_canvas_(self) -> None:
        '''
        This function gets called regularly by the timer.

        '''
        self._y_.append(round(get_next_datapoint(), 2))     # Add new datapoint
        self._y_ = self._y_[-self._x_len_:]                 # Truncate list _y_
        self._ax_.clear()                                   # Clear ax
        self._ax_.plot(self._x_, self._y_)                  # Plot y(x)
        self._ax_.set_ylim(ymin=self._y_range_[0], ymax=self._y_range_[1])
        self.draw()
        return

# Data source
# ------------
n = np.linspace(0, 499, 500)
d = 50 + 25 * (np.sin(n / 8.3)) + 10 * (np.sin(n / 7.5)) - 5 * (np.sin(n / 1.5))
i = 0
def get_next_datapoint():
    global i
    i += 1
    if i > 499:
        i = 0
    return d[i]

if __name__ == "__main__":
    qapp = QtWidgets.QApplication(sys.argv)
    app = ApplicationWindow()
    qapp.exec_()
您应该看到以下窗口:
第二个示例:我在这里找到了另一个实时matplotlib图形的例子:
https://learn.sparkfun.com/tutorials/graph-sensor-data-with-python-and-matplotlib/speeding-up-the-plot-animation
然而,作者没有使用PyQt5来嵌入他的实时绘图。因此,我稍微修改了一下代码,以在PyQt5窗口中获得绘图:
#####################################################################################
#                                                                                   #
#                PLOT A LIVE GRAPH IN A PYQT WINDOW                                 #
#                EXAMPLE 2                                                          #
#               ------------------------------------                                #
# This code is inspired on:                                                         #
# https://learn.sparkfun.com/tutorials/graph-sensor-data-with-python-and-matplotlib/speeding-up-the-plot-animation  #
#                                                                                   #
#####################################################################################

from __future__ import annotations
from typing import *
import sys
import os
from matplotlib.backends.qt_compat import QtCore, QtWidgets
# from PyQt5 import QtWidgets, QtCore
from matplotlib.backends.backend_qt5agg import FigureCanvas
# from matplotlib.backends.backend_qt5agg import FigureCanvasQTAgg as FigureCanvas
import matplotlib as mpl
import matplotlib.figure as mpl_fig
import matplotlib.animation as anim
import numpy as np

class ApplicationWindow(QtWidgets.QMainWindow):
    '''
    The PyQt5 main window.

    '''
    def __init__(self):
        super().__init__()
        # 1. Window settings
        self.setGeometry(300, 300, 800, 400)
        self.setWindowTitle("Matplotlib live plot in PyQt - example 2")
        self.frm = QtWidgets.QFrame(self)
        self.frm.setStyleSheet("QWidget { background-color: #eeeeec; }")
        self.lyt = QtWidgets.QVBoxLayout()
        self.frm.setLayout(self.lyt)
        self.setCentralWidget(self.frm)

        # 2. Place the matplotlib figure
        self.myFig = MyFigureCanvas(x_len=200, y_range=[0, 100], interval=20)
        self.lyt.addWidget(self.myFig)

        # 3. Show
        self.show()
        return

class MyFigureCanvas(FigureCanvas, anim.FuncAnimation):
    '''
    This is the FigureCanvas in which the live plot is drawn.

    '''
    def __init__(self, x_len:int, y_range:List, interval:int) -> None:
        '''
        :param x_len:       The nr of data points shown in one plot.
        :param y_range:     Range on y-axis.
        :param interval:    Get a new datapoint every .. milliseconds.

        '''
        FigureCanvas.__init__(self, mpl_fig.Figure())
        # Range settings
        self._x_len_ = x_len
        self._y_range_ = y_range

        # Store two lists _x_ and _y_
        x = list(range(0, x_len))
        y = [0] * x_len

        # Store a figure and ax
        self._ax_  = self.figure.subplots()
        self._ax_.set_ylim(ymin=self._y_range_[0], ymax=self._y_range_[1])
        self._line_, = self._ax_.plot(x, y)

        # Call superclass constructors
        anim.FuncAnimation.__init__(self, self.figure, self._update_canvas_, fargs=(y,), interval=interval, blit=True)
        return

    def _update_canvas_(self, i, y) -> None:
        '''
        This function gets called regularly by the timer.

        '''
        y.append(round(get_next_datapoint(), 2))     # Add new datapoint
        y = y[-self._x_len_:]                        # Truncate list _y_
        self._line_.set_ydata(y)
        return self._line_,

# Data source
# ------------
n = np.linspace(0, 499, 500)
d = 50 + 25 * (np.sin(n / 8.3)) + 10 * (np.sin(n / 7.5)) - 5 * (np.sin(n / 1.5))
i = 0
def get_next_datapoint():
    global i
    i += 1
    if i > 499:
        i = 0
    return d[i]

if __name__ == "__main__":
    qapp = QtWidgets.QApplication(sys.argv)
    app = ApplicationWindow()
    qapp.exec_()
结果得到的动态图是完全相同的。但是,如果你开始使用
MyFigureCanvas()构造函数中的interval参数,你会发现第一个例子无法跟随。第二个例子可以更快地运行。3. 问题
我有几个问题想要向您提出:
-
QtCore和QtWidgets类可以这样导入:from matplotlib.backends.qt_compat import QtCore, QtWidgets或者这样导入:
from PyQt5 import QtWidgets, QtCore两种方法都一样好。是否有理由优先选择其中一种?
-
FigureCanvas可以这样导入:from matplotlib.backends.backend_qt5agg import FigureCanvas或者这样导入:
from matplotlib.backends.backend_qt5agg import FigureCanvasQTAgg as FigureCanvas但是我已经弄清楚了为什么。
backend_qt5agg文件似乎将FigureCanvas定义为FigureCanvasQTAgg的别名。- 为什么第二个例子比第一个例子快那么多?老实说,这让我感到惊讶。第一个示例基于官方matplotlib网站上的一个网页。我期望那个更好。
- 您有任何建议可以使第二个示例运行得更快吗?
4. 编辑
根据这个网页:
https://bastibe.de/2013-05-30-speeding-up-matplotlib.html
我修改了第一个示例以增加其速度。请查看以下代码:
#####################################################################################
#                                                                                   #
#                PLOT A LIVE GRAPH IN A PYQT WINDOW                                 #
#                EXAMPLE 1 (modified for extra speed)                               #
#               --------------------------------------                              #
# This code is inspired on:                                                         #
# https://matplotlib.org/3.1.1/gallery/user_interfaces/embedding_in_qt_sgskip.html  #
# and on:                                                                           #
# https://bastibe.de/2013-05-30-speeding-up-matplotlib.html                         #
#                                                                                   #
#####################################################################################

from __future__ import annotations
from typing import *
import sys
import os
from matplotlib.backends.qt_compat import QtCore, QtWidgets
# from PyQt5 import QtWidgets, QtCore
from matplotlib.backends.backend_qt5agg import FigureCanvas
# from matplotlib.backends.backend_qt5agg import FigureCanvasQTAgg as FigureCanvas
import matplotlib as mpl
import numpy as np

class ApplicationWindow(QtWidgets.QMainWindow):
    '''
    The PyQt5 main window.

    '''
    def __init__(self):
        super().__init__()
        # 1. Window settings
        self.setGeometry(300, 300, 800, 400)
        self.setWindowTitle("Matplotlib live plot in PyQt - example 1 (modified for extra speed)")
        self.frm = QtWidgets.QFrame(self)
        self.frm.setStyleSheet("QWidget { background-color: #eeeeec; }")
        self.lyt = QtWidgets.QVBoxLayout()
        self.frm.setLayout(self.lyt)
        self.setCentralWidget(self.frm)

        # 2. Place the matplotlib figure
        self.myFig = MyFigureCanvas(x_len=200, y_range=[0, 100], interval=1)
        self.lyt.addWidget(self.myFig)

        # 3. Show
        self.show()
        return

class MyFigureCanvas(FigureCanvas):
    '''
    This is the FigureCanvas in which the live plot is drawn.

    '''
    def __init__(self, x_len:int, y_range:List, interval:int) -> None:
        '''
        :param x_len:       The nr of data points shown in one plot.
        :param y_range:     Range on y-axis.
        :param interval:    Get a new datapoint every .. milliseconds.

        '''
        super().__init__(mpl.figure.Figure())
        # Range settings
        self._x_len_ = x_len
        self._y_range_ = y_range

        # Store two lists _x_ and _y_
        self._x_ = list(range(0, x_len))
        self._y_ = [0] * x_len

        # Store a figure ax
        self._ax_ = self.figure.subplots()
        self._ax_.set_ylim(ymin=self._y_range_[0], ymax=self._y_range_[1]) # added
        self._line_, = self._ax_.plot(self._x_, self._y_)                  # added
        self.draw()                                                        # added

        # Initiate the timer
        self._timer_ = self.new_timer(interval, [(self._update_canvas_, (), {})])
        self._timer_.start()
        return

    def _update_canvas_(self) -> None:
        '''
        This function gets called regularly by the timer.

        '''
        self._y_.append(round(get_next_datapoint(), 2))     # Add new datapoint
        self._y_ = self._y_[-self._x_len_:]                 # Truncate list y

        # Previous code
        # --------------
        # self._ax_.clear()                                   # Clear ax
        # self._ax_.plot(self._x_, self._y_)                  # Plot y(x)
        # self._ax_.set_ylim(ymin=self._y_range_[0], ymax=self._y_range_[1])
        # self.draw()

        # New code
        # ---------
        self._line_.set_ydata(self._y_)
        self._ax_.draw_artist(self._ax_.patch)
        self._ax_.draw_artist(self._line_)
        self.update()
        self.flush_events()
        return

# Data source
# ------------
n = np.linspace(0, 499, 500)
d = 50 + 25 * (np.sin(n / 8.3)) + 10 * (np.sin(n / 7.5)) - 5 * (np.sin(n / 1.5))
i = 0
def get_next_datapoint():
    global i
    i += 1
    if i > 499:
        i = 0
    return d[i]

if __name__ == "__main__":
    qapp = QtWidgets.QApplication(sys.argv)
    app = ApplicationWindow()
    qapp.exec_()
结果非常惊人。这些修改使得第一个示例的速度显著提高!然而,我不知道这是否使得第一个示例现在和第二个示例的速度相同。它们肯定接近。有人知道哪个更快吗?
此外,我注意到左侧缺少一条竖线,顶部缺少一条横线:
这不是什么大问题,但我只是想知道为什么会这样。
pyqtgraph会很方便,就像这个问答中所述。 - ImportanceOfBeingErnestpyqtgraph的提示。我以前尝试过它,并且同意它是一个不错的选择。然而,这个包的开发似乎几乎被放弃了。最后一个版本0.10.0是在2016年11月5日发布的。 - K.Mulierfig.canvas.restore_region(axbackground)来恢复背景,并仅使线本身闪烁。 - ImportanceOfBeingErnest