我如何在while循环中实时绘制图表?

346

我正在尝试使用OpenCV实时绘制来自相机的一些数据。然而,实时绘图(使用matplotlib)似乎无法正常工作。

我已将问题隔离到这个简单的示例中:

fig = plt.figure()
plt.axis([0, 1000, 0, 1])

i = 0
x = list()
y = list()

while i < 1000:
    temp_y = np.random.random()
    x.append(i)
    y.append(temp_y)
    plt.scatter(i, temp_y)
    i += 1
    plt.show()

我期望这个例子会逐个绘制1000个点。但实际上窗口弹出时只显示第一个点(没问题),然后等待循环结束才填充图表的其余部分。
你有什么想法,为什么我没有看到逐个填充点呢?
15个回答

404

以下是工作版的相关代码(需要Matplotlib版本至少为2011年11月14日发布的1.1.0版本):

import numpy as np
import matplotlib.pyplot as plt

plt.axis([0, 10, 0, 1])

for i in range(10):
    y = np.random.random()
    plt.scatter(i, y)
    plt.pause(0.05)

plt.show()

请注意调用 plt.pause(0.05),它既绘制新数据,又运行GUI的事件循环(允许鼠标交互)。

4
这个方法在Python2中可以使用,在Python3中不行。在绘制图像后会暂停循环,但是将plt.show()方法放到循环之后可以解决这个问题。对我来说,在Python3中问题得到了解决。 - continuousqa
1
在我的Python 3(版本3.4.0),Matplotlib(版本1.3.1)和Numpy(版本1.8.1)及Ubuntu Linux 3.13.0 64位系统中运行良好,有点奇怪。 - Velimir Mlaker
50
不要使用plt.show()和plt.draw(),只需将plt.draw()替换为plt.pause(0.1)。 - denfromufa
6
在Win64/Anaconda环境下,matplotlib.version 1.5.0无法正常工作。初始绘图窗口会打开,但不会显示任何内容,它会一直保持阻塞状态,直到被关闭。 - isti_spl
9
这个答案需要先了解 x/y 数据,但其实并不需要这些知识。以下是更好的方式:1. 不要使用 plt.axis(),而是创建两个列表 x 和 y 并使用plt.plot(x,y) 2. 在循环中,将新的数据值添加到这两个列表中 3. 调用plt.gca().lines[0].set_xdata(x); plt.gca().lines[0].set_ydata(y); plt.gca().relim(); plt.gca().autoscale_view(); plt.pause(0.05); - Trevor Boyd Smith
显示剩余10条评论

106

如果您对实时绘图感兴趣,我建议您研究一下matplotlib的动画API。特别是使用blit来避免在每帧重新绘制背景,可以获得相当大的速度提升(约10倍):

#!/usr/bin/env python

import numpy as np
import time
import matplotlib
matplotlib.use('GTKAgg')
from matplotlib import pyplot as plt


def randomwalk(dims=(256, 256), n=20, sigma=5, alpha=0.95, seed=1):
    """ A simple random walk with memory """

    r, c = dims
    gen = np.random.RandomState(seed)
    pos = gen.rand(2, n) * ((r,), (c,))
    old_delta = gen.randn(2, n) * sigma

    while True:
        delta = (1. - alpha) * gen.randn(2, n) * sigma + alpha * old_delta
        pos += delta
        for ii in xrange(n):
            if not (0. <= pos[0, ii] < r):
                pos[0, ii] = abs(pos[0, ii] % r)
            if not (0. <= pos[1, ii] < c):
                pos[1, ii] = abs(pos[1, ii] % c)
        old_delta = delta
        yield pos


def run(niter=1000, doblit=True):
    """
    Display the simulation using matplotlib, optionally using blit for speed
    """

    fig, ax = plt.subplots(1, 1)
    ax.set_aspect('equal')
    ax.set_xlim(0, 255)
    ax.set_ylim(0, 255)
    ax.hold(True)
    rw = randomwalk()
    x, y = rw.next()

    plt.show(False)
    plt.draw()

    if doblit:
        # cache the background
        background = fig.canvas.copy_from_bbox(ax.bbox)

    points = ax.plot(x, y, 'o')[0]
    tic = time.time()

    for ii in xrange(niter):

        # update the xy data
        x, y = rw.next()
        points.set_data(x, y)

        if doblit:
            # restore background
            fig.canvas.restore_region(background)

            # redraw just the points
            ax.draw_artist(points)

            # fill in the axes rectangle
            fig.canvas.blit(ax.bbox)

        else:
            # redraw everything
            fig.canvas.draw()

    plt.close(fig)
    print "Blit = %s, average FPS: %.2f" % (
        str(doblit), niter / (time.time() - tic))

if __name__ == '__main__':
    run(doblit=False)
    run(doblit=True)

输出:

Blit = False, average FPS: 54.37
Blit = True, average FPS: 438.27

1
@bejota 原始版本是设计在交互式的matplotlib会话中运行的。为了使其作为独立脚本工作,需要 1) 显式选择一个matplotlib后端,并且 2) 在进入动画循环之前强制显示和绘制图形,使用 plt.show()plt.draw()。我已经将这些更改添加到上面的代码中。 - ali_m
3
blit()的意图/动机是否非常注重于“改善实时绘图”?如果有Matplotlib开发者/博客讨论其用途/目的/意图/动机,那就太好了。(似乎这种新的blit操作将把Matplotlib从仅用于离线或变化缓慢的数据转变为现在可以使用Matplotlib处理非常快速更新的数据...几乎像示波器)blit()函数的目的是提高实时绘图的性能。如果有Matplotlib开发者或博客对其原因、目的、意图和动机进行讨论,那将非常有益。这个新的blit()操作似乎将Matplotlib从仅用于离线或变化缓慢的数据转变为可以处理非常快速更新的数据,几乎像一个示波器。 - Trevor Boyd Smith
2
我发现这种方法会导致绘图窗口无响应:我无法与之交互,这样做可能会导致崩溃。 - Ninjakannon
2
对于那些遇到“gtk未找到”问题的人,使用不同的后端(我使用了'TKAgg')可以正常工作。要查找支持的后端,我使用了这个解决方案:https://dev59.com/KnA75IYBdhLWcg3wdIz7 - James Nelson
2
这个答案中的链接似乎已经失效了。这可能是最新的链接:http://scipy-cookbook.readthedocs.io/items/Matplotlib_Animations.html?highlight=animations - awelkie
显示剩余3条评论

59

我知道回答这个问题有些晚了。尽管如此,我之前写过一些代码来绘制实时图表,我想分享一下:

PyQt4的代码:

###################################################################
#                                                                 #
#                    PLOT A LIVE GRAPH (PyQt4)                    #
#                  -----------------------------                  #
#            EMBED A MATPLOTLIB ANIMATION INSIDE YOUR             #
#            OWN GUI!                                             #
#                                                                 #
###################################################################


import sys
import os
from PyQt4 import QtGui
from PyQt4 import QtCore
import functools
import numpy as np
import random as rd
import matplotlib
matplotlib.use("Qt4Agg")
from matplotlib.figure import Figure
from matplotlib.animation import TimedAnimation
from matplotlib.lines import Line2D
from matplotlib.backends.backend_qt4agg import FigureCanvasQTAgg as FigureCanvas
import time
import threading


def setCustomSize(x, width, height):
    sizePolicy = QtGui.QSizePolicy(QtGui.QSizePolicy.Fixed, QtGui.QSizePolicy.Fixed)
    sizePolicy.setHorizontalStretch(0)
    sizePolicy.setVerticalStretch(0)
    sizePolicy.setHeightForWidth(x.sizePolicy().hasHeightForWidth())
    x.setSizePolicy(sizePolicy)
    x.setMinimumSize(QtCore.QSize(width, height))
    x.setMaximumSize(QtCore.QSize(width, height))

''''''

class CustomMainWindow(QtGui.QMainWindow):

    def __init__(self):

        super(CustomMainWindow, self).__init__()

        # Define the geometry of the main window
        self.setGeometry(300, 300, 800, 400)
        self.setWindowTitle("my first window")

        # Create FRAME_A
        self.FRAME_A = QtGui.QFrame(self)
        self.FRAME_A.setStyleSheet("QWidget { background-color: %s }" % QtGui.QColor(210,210,235,255).name())
        self.LAYOUT_A = QtGui.QGridLayout()
        self.FRAME_A.setLayout(self.LAYOUT_A)
        self.setCentralWidget(self.FRAME_A)

        # Place the zoom button
        self.zoomBtn = QtGui.QPushButton(text = 'zoom')
        setCustomSize(self.zoomBtn, 100, 50)
        self.zoomBtn.clicked.connect(self.zoomBtnAction)
        self.LAYOUT_A.addWidget(self.zoomBtn, *(0,0))

        # Place the matplotlib figure
        self.myFig = CustomFigCanvas()
        self.LAYOUT_A.addWidget(self.myFig, *(0,1))

        # Add the callbackfunc to ..
        myDataLoop = threading.Thread(name = 'myDataLoop', target = dataSendLoop, daemon = True, args = (self.addData_callbackFunc,))
        myDataLoop.start()

        self.show()

    ''''''


    def zoomBtnAction(self):
        print("zoom in")
        self.myFig.zoomIn(5)

    ''''''

    def addData_callbackFunc(self, value):
        # print("Add data: " + str(value))
        self.myFig.addData(value)


''' End Class '''


class CustomFigCanvas(FigureCanvas, TimedAnimation):

    def __init__(self):

        self.addedData = []
        print(matplotlib.__version__)

        # The data
        self.xlim = 200
        self.n = np.linspace(0, self.xlim - 1, self.xlim)
        a = []
        b = []
        a.append(2.0)
        a.append(4.0)
        a.append(2.0)
        b.append(4.0)
        b.append(3.0)
        b.append(4.0)
        self.y = (self.n * 0.0) + 50

        # The window
        self.fig = Figure(figsize=(5,5), dpi=100)
        self.ax1 = self.fig.add_subplot(111)


        # self.ax1 settings
        self.ax1.set_xlabel('time')
        self.ax1.set_ylabel('raw data')
        self.line1 = Line2D([], [], color='blue')
        self.line1_tail = Line2D([], [], color='red', linewidth=2)
        self.line1_head = Line2D([], [], color='red', marker='o', markeredgecolor='r')
        self.ax1.add_line(self.line1)
        self.ax1.add_line(self.line1_tail)
        self.ax1.add_line(self.line1_head)
        self.ax1.set_xlim(0, self.xlim - 1)
        self.ax1.set_ylim(0, 100)


        FigureCanvas.__init__(self, self.fig)
        TimedAnimation.__init__(self, self.fig, interval = 50, blit = True)

    def new_frame_seq(self):
        return iter(range(self.n.size))

    def _init_draw(self):
        lines = [self.line1, self.line1_tail, self.line1_head]
        for l in lines:
            l.set_data([], [])

    def addData(self, value):
        self.addedData.append(value)

    def zoomIn(self, value):
        bottom = self.ax1.get_ylim()[0]
        top = self.ax1.get_ylim()[1]
        bottom += value
        top -= value
        self.ax1.set_ylim(bottom,top)
        self.draw()


    def _step(self, *args):
        # Extends the _step() method for the TimedAnimation class.
        try:
            TimedAnimation._step(self, *args)
        except Exception as e:
            self.abc += 1
            print(str(self.abc))
            TimedAnimation._stop(self)
            pass

    def _draw_frame(self, framedata):
        margin = 2
        while(len(self.addedData) > 0):
            self.y = np.roll(self.y, -1)
            self.y[-1] = self.addedData[0]
            del(self.addedData[0])


        self.line1.set_data(self.n[ 0 : self.n.size - margin ], self.y[ 0 : self.n.size - margin ])
        self.line1_tail.set_data(np.append(self.n[-10:-1 - margin], self.n[-1 - margin]), np.append(self.y[-10:-1 - margin], self.y[-1 - margin]))
        self.line1_head.set_data(self.n[-1 - margin], self.y[-1 - margin])
        self._drawn_artists = [self.line1, self.line1_tail, self.line1_head]

''' End Class '''

# You need to setup a signal slot mechanism, to 
# send data to your GUI in a thread-safe way.
# Believe me, if you don't do this right, things
# go very very wrong..
class Communicate(QtCore.QObject):
    data_signal = QtCore.pyqtSignal(float)

''' End Class '''


def dataSendLoop(addData_callbackFunc):
    # Setup the signal-slot mechanism.
    mySrc = Communicate()
    mySrc.data_signal.connect(addData_callbackFunc)

    # Simulate some data
    n = np.linspace(0, 499, 500)
    y = 50 + 25*(np.sin(n / 8.3)) + 10*(np.sin(n / 7.5)) - 5*(np.sin(n / 1.5))
    i = 0

    while(True):
        if(i > 499):
            i = 0
        time.sleep(0.1)
        mySrc.data_signal.emit(y[i]) # <- Here you emit a signal!
        i += 1
    ###
###


if __name__== '__main__':
    app = QtGui.QApplication(sys.argv)
    QtGui.QApplication.setStyle(QtGui.QStyleFactory.create('Plastique'))
    myGUI = CustomMainWindow()
    sys.exit(app.exec_())

''''''

最近我重写了PyQt5的代码。
PyQt5代码:

###################################################################
#                                                                 #
#                    PLOT A LIVE GRAPH (PyQt5)                    #
#                  -----------------------------                  #
#            EMBED A MATPLOTLIB ANIMATION INSIDE YOUR             #
#            OWN GUI!                                             #
#                                                                 #
###################################################################

import sys
import os
from PyQt5.QtWidgets import *
from PyQt5.QtCore import *
from PyQt5.QtGui import *
import functools
import numpy as np
import random as rd
import matplotlib
matplotlib.use("Qt5Agg")
from matplotlib.figure import Figure
from matplotlib.animation import TimedAnimation
from matplotlib.lines import Line2D
from matplotlib.backends.backend_qt5agg import FigureCanvasQTAgg as FigureCanvas
import time
import threading

class CustomMainWindow(QMainWindow):
    def __init__(self):
        super(CustomMainWindow, self).__init__()
        # Define the geometry of the main window
        self.setGeometry(300, 300, 800, 400)
        self.setWindowTitle("my first window")
        # Create FRAME_A
        self.FRAME_A = QFrame(self)
        self.FRAME_A.setStyleSheet("QWidget { background-color: %s }" % QColor(210,210,235,255).name())
        self.LAYOUT_A = QGridLayout()
        self.FRAME_A.setLayout(self.LAYOUT_A)
        self.setCentralWidget(self.FRAME_A)
        # Place the zoom button
        self.zoomBtn = QPushButton(text = 'zoom')
        self.zoomBtn.setFixedSize(100, 50)
        self.zoomBtn.clicked.connect(self.zoomBtnAction)
        self.LAYOUT_A.addWidget(self.zoomBtn, *(0,0))
        # Place the matplotlib figure
        self.myFig = CustomFigCanvas()
        self.LAYOUT_A.addWidget(self.myFig, *(0,1))
        # Add the callbackfunc to ..
        myDataLoop = threading.Thread(name = 'myDataLoop', target = dataSendLoop, daemon = True, args = (self.addData_callbackFunc,))
        myDataLoop.start()
        self.show()
        return

    def zoomBtnAction(self):
        print("zoom in")
        self.myFig.zoomIn(5)
        return

    def addData_callbackFunc(self, value):
        # print("Add data: " + str(value))
        self.myFig.addData(value)
        return

''' End Class '''


class CustomFigCanvas(FigureCanvas, TimedAnimation):
    def __init__(self):
        self.addedData = []
        print(matplotlib.__version__)
        # The data
        self.xlim = 200
        self.n = np.linspace(0, self.xlim - 1, self.xlim)
        a = []
        b = []
        a.append(2.0)
        a.append(4.0)
        a.append(2.0)
        b.append(4.0)
        b.append(3.0)
        b.append(4.0)
        self.y = (self.n * 0.0) + 50
        # The window
        self.fig = Figure(figsize=(5,5), dpi=100)
        self.ax1 = self.fig.add_subplot(111)
        # self.ax1 settings
        self.ax1.set_xlabel('time')
        self.ax1.set_ylabel('raw data')
        self.line1 = Line2D([], [], color='blue')
        self.line1_tail = Line2D([], [], color='red', linewidth=2)
        self.line1_head = Line2D([], [], color='red', marker='o', markeredgecolor='r')
        self.ax1.add_line(self.line1)
        self.ax1.add_line(self.line1_tail)
        self.ax1.add_line(self.line1_head)
        self.ax1.set_xlim(0, self.xlim - 1)
        self.ax1.set_ylim(0, 100)
        FigureCanvas.__init__(self, self.fig)
        TimedAnimation.__init__(self, self.fig, interval = 50, blit = True)
        return

    def new_frame_seq(self):
        return iter(range(self.n.size))

    def _init_draw(self):
        lines = [self.line1, self.line1_tail, self.line1_head]
        for l in lines:
            l.set_data([], [])
        return

    def addData(self, value):
        self.addedData.append(value)
        return

    def zoomIn(self, value):
        bottom = self.ax1.get_ylim()[0]
        top = self.ax1.get_ylim()[1]
        bottom += value
        top -= value
        self.ax1.set_ylim(bottom,top)
        self.draw()
        return

    def _step(self, *args):
        # Extends the _step() method for the TimedAnimation class.
        try:
            TimedAnimation._step(self, *args)
        except Exception as e:
            self.abc += 1
            print(str(self.abc))
            TimedAnimation._stop(self)
            pass
        return

    def _draw_frame(self, framedata):
        margin = 2
        while(len(self.addedData) > 0):
            self.y = np.roll(self.y, -1)
            self.y[-1] = self.addedData[0]
            del(self.addedData[0])

        self.line1.set_data(self.n[ 0 : self.n.size - margin ], self.y[ 0 : self.n.size - margin ])
        self.line1_tail.set_data(np.append(self.n[-10:-1 - margin], self.n[-1 - margin]), np.append(self.y[-10:-1 - margin], self.y[-1 - margin]))
        self.line1_head.set_data(self.n[-1 - margin], self.y[-1 - margin])
        self._drawn_artists = [self.line1, self.line1_tail, self.line1_head]
        return

''' End Class '''


# You need to setup a signal slot mechanism, to
# send data to your GUI in a thread-safe way.
# Believe me, if you don't do this right, things
# go very very wrong..
class Communicate(QObject):
    data_signal = pyqtSignal(float)

''' End Class '''


def dataSendLoop(addData_callbackFunc):
    # Setup the signal-slot mechanism.
    mySrc = Communicate()
    mySrc.data_signal.connect(addData_callbackFunc)

    # Simulate some data
    n = np.linspace(0, 499, 500)
    y = 50 + 25*(np.sin(n / 8.3)) + 10*(np.sin(n / 7.5)) - 5*(np.sin(n / 1.5))
    i = 0

    while(True):
        if(i > 499):
            i = 0
        time.sleep(0.1)
        mySrc.data_signal.emit(y[i]) # <- Here you emit a signal!
        i += 1
    ###
###

if __name__== '__main__':
    app = QApplication(sys.argv)
    QApplication.setStyle(QStyleFactory.create('Plastique'))
    myGUI = CustomMainWindow()
    sys.exit(app.exec_())

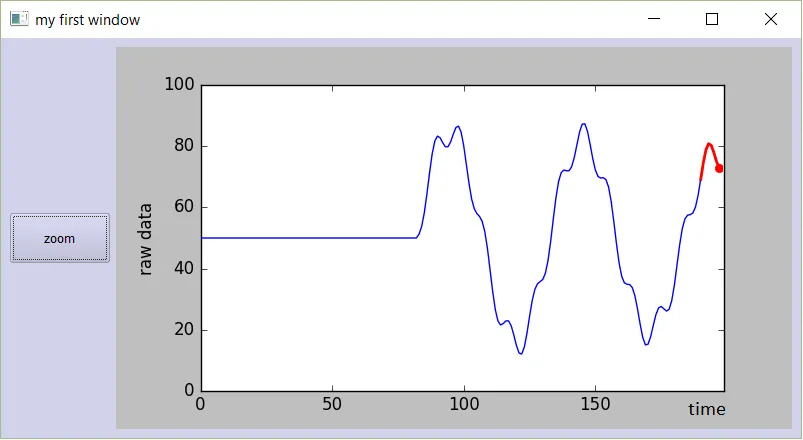
试一试吧。将这段代码复制粘贴到一个新的Python文件中并运行它。你应该得到一个漂亮而平滑移动的图形:

在此输入图片描述


2
我注意到当你关闭窗口时,dataSendLoop 线程仍在后台运行。因此,我添加了 daemon = True 关键字来解决这个问题。 - K.Mulier
3
非常感谢您提供的基础代码,它帮助我在您的代码基础上修改和添加一些功能,从而构建了一些简单的用户界面。这节省了我的时间 =] - Isaac Sim
1
作为稍微官方的替代选择,您也可以使用PyQtGraph,它是建立在官方支持的Python绑定Qt(PySide6)之上的。 - David Cian
2
@DavidCian,没有比带有可工作代码的帖子更好的选择了。 - Paul
2
@Paul酷,在这里是我自己使用的示例。如果有效的代码总是好的代码,软件工程就不会存在;)。事实证明,PyQtGraph客观上更好,因为它从一开始就设计用于在线绘图,与Matplotlib非常不同。 - David Cian
显示剩余6条评论

47

很多答案都基于plt.pause(),但这是matplotlib中旧的绘图方式。它不仅速度慢,而且每次更新时会抓住焦点(我很难停止绘制python进程)。

简而言之:您可能想使用matplotlib.animation如文档所述)。

在研究各种答案和代码片段后,事实证明这对于我来说是一种无限绘制输入数据的平滑方式。

以下是我的示例代码。它以200毫秒的间隔无限制地绘制当前时间和[0,100)范围内的随机数,同时处理视图的自动重新缩放:

from datetime import datetime
from matplotlib import pyplot
from matplotlib.animation import FuncAnimation
from random import randrange

x_data, y_data = [], []

figure = pyplot.figure()
line, = pyplot.plot_date(x_data, y_data, '-')

def update(frame):
    x_data.append(datetime.now())
    y_data.append(randrange(0, 100))
    line.set_data(x_data, y_data)
    figure.gca().relim()
    figure.gca().autoscale_view()
    return line,

animation = FuncAnimation(figure, update, interval=200)

pyplot.show()

你还可以探索blit,以获得更好的性能如FuncAnimation文档中所述

blit文档中的一个例子:

import numpy as np
import matplotlib.pyplot as plt
from matplotlib.animation import FuncAnimation

fig, ax = plt.subplots()
xdata, ydata = [], []
ln, = plt.plot([], [], 'ro')

def init():
    ax.set_xlim(0, 2*np.pi)
    ax.set_ylim(-1, 1)
    return ln,

def update(frame):
    xdata.append(frame)
    ydata.append(np.sin(frame))
    ln.set_data(xdata, ydata)
    return ln,

ani = FuncAnimation(fig, update, frames=np.linspace(0, 2*np.pi, 128),
                    init_func=init, blit=True)
plt.show()

2
你好,如果这一切都在一个循环中会发生什么呢?比如说 for i in range(1000): x,y = some func_func()。这里的 some_func() 生成在线的 x,y 数据对,我想在它们可用时绘制它们。是否可以使用 FuncAnimation 实现这一点?我的目标是在每次迭代中逐步构建由数据定义的曲线。 - Alexander Cska
我担心我没有真正理解你的回复。请问你能详细说明一下你的建议吗? - Alexander Cska
我的意思是,如果你在循环中调用 pyplot.show,那么这个调用会阻塞循环并且不会继续执行。如果你想逐步添加数据到曲线中,请将你的逻辑放在 update 中,它会在每个 interval 被调用,因此也是逐步的。 - Hai Zhang
update()函数中的return line语句似乎是不必要的。 - Casey Jones
运行时会出现分段错误。 - france1
显示剩余3条评论

42

对我来说,这些方法都不起作用。但我发现了这个链接:Real time matplotlib plot is not working while still in a loop

你只需要添加如下代码:

plt.pause(0.0001)

然后你就可以看到新的图表了。

所以你的代码应该像这样,并且它将会执行。

import matplotlib.pyplot as plt
import numpy as np
plt.ion() ## Note this correction
fig=plt.figure()
plt.axis([0,1000,0,1])

i=0
x=list()
y=list()

while i <1000:
    temp_y=np.random.random();
    x.append(i);
    y.append(temp_y);
    plt.scatter(i,temp_y);
    i+=1;
    plt.show()
    plt.pause(0.0001) #Note this correction

11
每次运行这段代码会打开一个新的图形或绘图窗口,有没有办法只更新现有的图形?可能是因为我在使用imshow函数吗? - Francisco Vargas
@FranciscoVargas 如果你正在使用imshow,你需要使用set_data,请看这里:https://dev59.com/ZGMm5IYBdhLWcg3wIsbj - Oren

34

show 可能不是最好的选择。我建议使用 pyplot.draw() 代替。你可能还想在循环中加入一个小的时间延迟(例如 time.sleep(0.05)),这样你就可以看到绘图发生的过程。如果我对你的示例进行这些更改,它对我有效,我会看到每个点逐个出现。


14
我有一段非常类似的代码,当我尝试你的解决方案(使用绘图而不是显示,并增加时间延迟)时,Python 根本不会打开任何图形窗口,只是直接通过循环... - George Aprilis

18

我知道这个问题很旧了,但现在有一个名为drawnow的包在GitHub上可用,名为 "python-drawnow"。这提供了类似于MATLAB的drawnow的界面--你可以轻松地更新一个图形。

以下是适用于您的用例的示例:

import matplotlib.pyplot as plt
from drawnow import drawnow

def make_fig():
    plt.scatter(x, y)  # I think you meant this

plt.ion()  # enable interactivity
fig = plt.figure()  # make a figure

x = list()
y = list()

for i in range(1000):
    temp_y = np.random.random()
    x.append(i)
    y.append(temp_y)  # or any arbitrary update to your figure's data
    i += 1
    drawnow(make_fig)

python-drawnow是对plt.draw的简单封装,但它能够在图形显示后提供确认(或调试)的功能。


这会导致Tk卡在某个地方。 - chwi
1
如果需要更多上下文,请在 https://github.com/scottsievert/python-drawnow/issues 上提交问题。 - Scott
1
+1 这对我来说非常有效,可以在opencv视频捕获的每一帧中绘制实时数据,而matplotlib会冻结。 - jj080808
我尝试了这个方法,似乎比其他方法要慢。 - Dave C
不要使用,我的服务器重新启动,Matplotlib 崩溃了。 - big-vl
不起作用,它会创建很多图形。 - Hassan Daoud

8

另一个选择是使用bokeh。在我看来,至少对于实时图表来说,它是一个不错的替代方案。以下是问题代码的bokeh版本:

from bokeh.plotting import curdoc, figure
import random
import time

def update():
    global i
    temp_y = random.random()
    r.data_source.stream({'x': [i], 'y': [temp_y]})
    i += 1

i = 0
p = figure()
r = p.circle([], [])
curdoc().add_root(p)
curdoc().add_periodic_callback(update, 100)

并且运行它:

pip3 install bokeh
bokeh serve --show test.py

Bokeh 通过 WebSocket 通信在 Web 浏览器中显示结果。当数据由远程无头服务器进程生成时,它尤其有用。

bokeh 样例图


1
是的 @samisnotinsane,但需要进行一些修改。请参考push_notebook()的文档和相关教程。 - Hamid Fadishei

6

这是我在我的系统上成功运行的一个版本。

import matplotlib.pyplot as plt
from drawnow import drawnow
import numpy as np

def makeFig():
    plt.scatter(xList,yList) # I think you meant this

plt.ion() # enable interactivity
fig=plt.figure() # make a figure

xList=list()
yList=list()

for i in np.arange(50):
    y=np.random.random()
    xList.append(i)
    yList.append(y)
    drawnow(makeFig)
    #makeFig()      The drawnow(makeFig) command can be replaced
    #plt.draw()     with makeFig(); plt.draw()
    plt.pause(0.001)

drawnow(makeFig)这一行可以用makeFig(); plt.draw()序列代替,而且仍然可以正常工作。


1
你如何知道需要暂停多长时间?这似乎取决于图形本身。 - CMCDragonkai
不起作用,它会创建很多图形。 - Hassan Daoud

6

一个实时绘制 CPU 使用率的应用示例。

import time
import psutil
import matplotlib.pyplot as plt

fig = plt.figure()
ax = fig.add_subplot(111)

i = 0
x, y = [], []

while True:
    x.append(i)
    y.append(psutil.cpu_percent())

    ax.plot(x, y, color='b')

    fig.canvas.draw()

    ax.set_xlim(left=max(0, i - 50), right=i + 50)
    fig.show()
    plt.pause(0.05)
    i += 1

大约两分钟后,它真的开始变慢了。可能的原因是早期的点落在当前视图之外,应该被删除。 - pfabri
这看起来非常不错,但是它有几个问题:1.无法退出2.仅几分钟后,程序就会消耗近100 Mb的RAM,并开始显著减慢。 - pfabri
评论中出现问题的原因是算法在追加新值时没有删除旧值(尽管它只显示最后50个步骤)。如果超过绘图限制,最好使用具有最大大小的队列从数组开头删除旧值(对x和y都使用pop(0))。 - nrofis

网页内容由stack overflow 提供, 点击上面的
可以查看英文原文,
原文链接