如何在两个层级上避免点范围 ggplot?

15

我想制作一个点范围图,使得不同分组的点不会叠在一起。这个图应该看起来像这样:
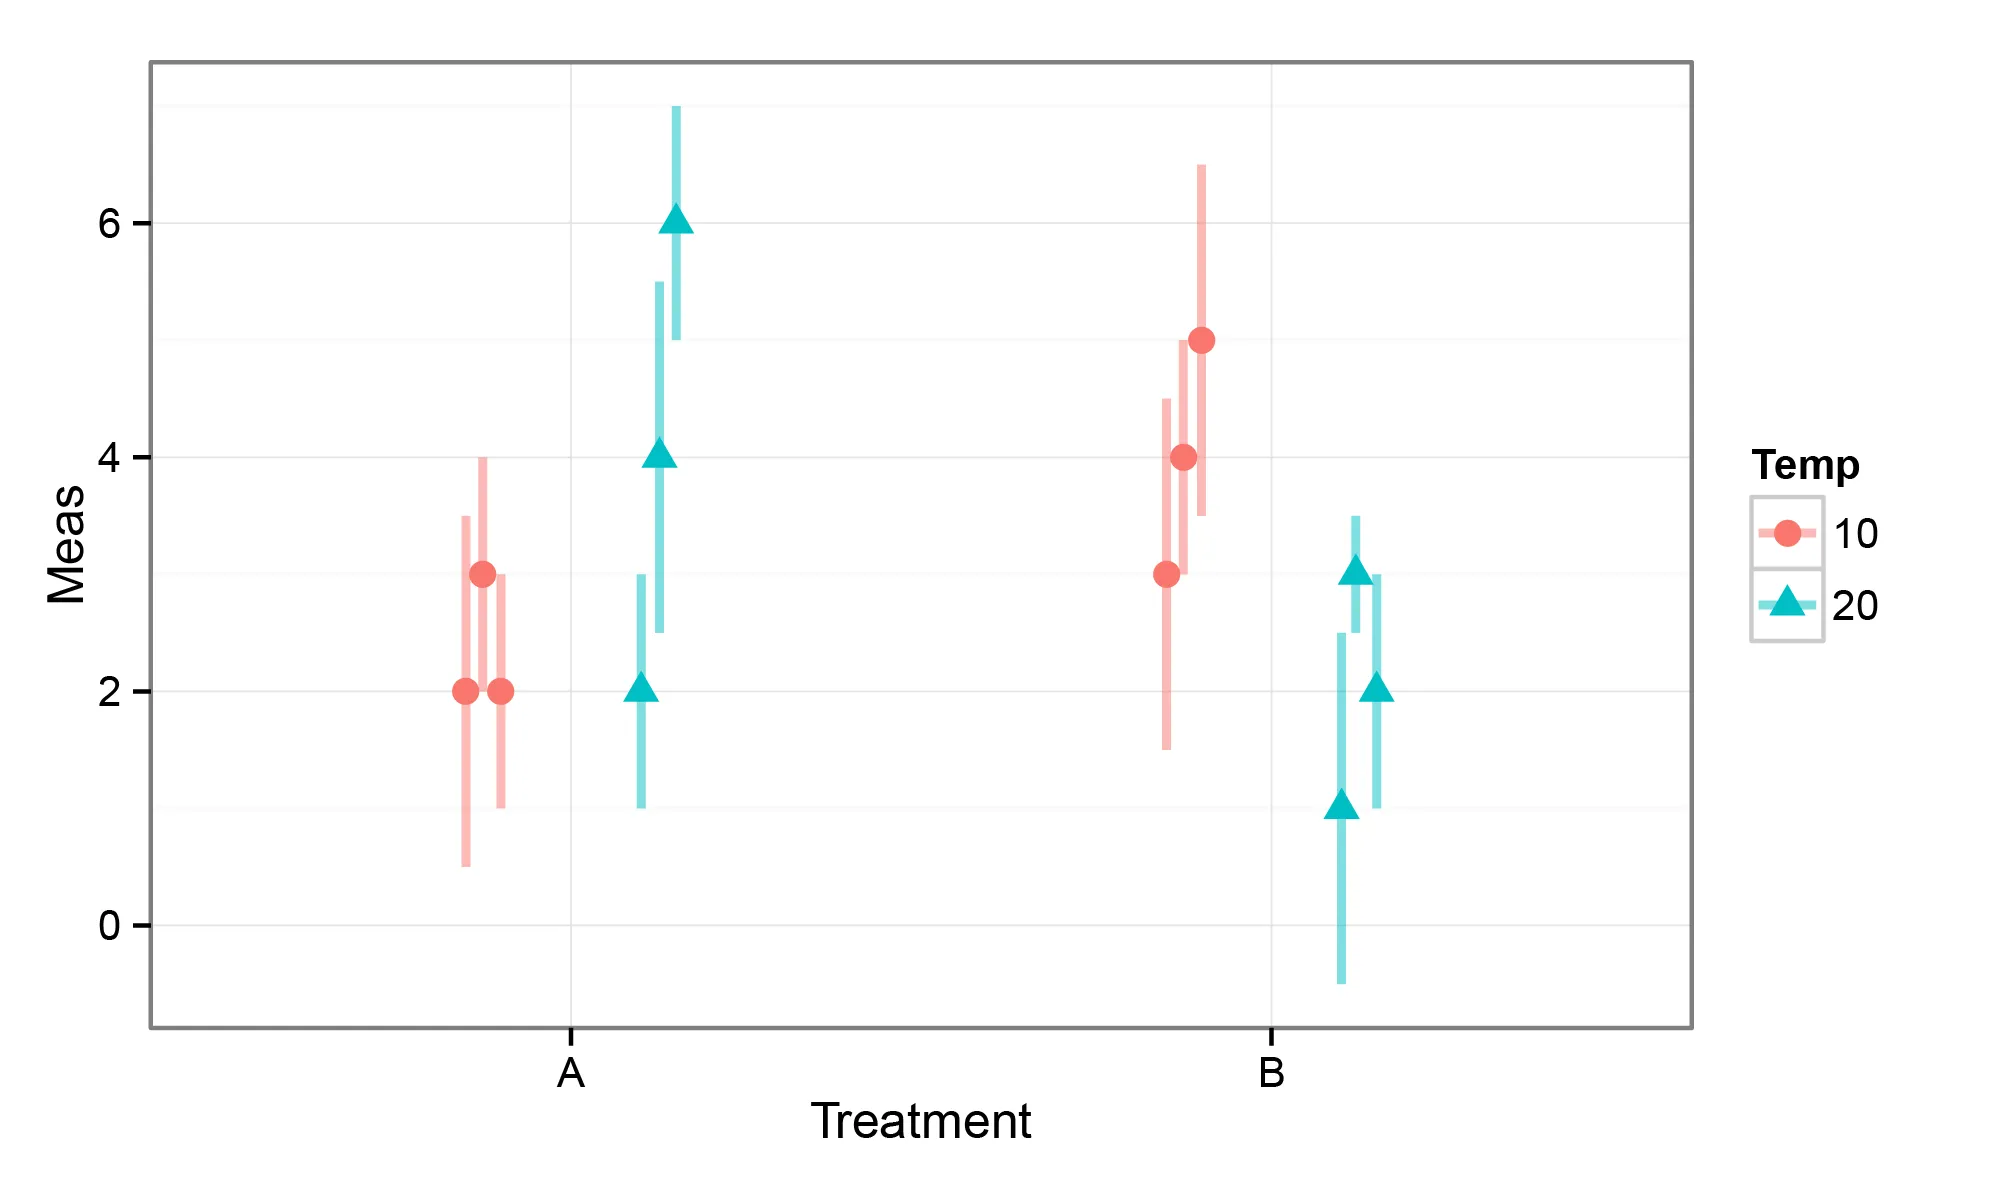
enter image description here

我尝试使用dodge参数中的向量来实现闪避:

library(ggplot2)

dat <- structure(list(Treatment = structure(c(1L, 1L, 1L, 1L, 1L, 1L, 
2L, 2L, 2L, 2L, 2L, 2L), .Label = c("A", "B"), class = "factor"), 
    Temp = structure(c(1L, 1L, 1L, 2L, 2L, 2L, 1L, 1L, 1L, 2L, 
    2L, 2L), .Label = c("10", "20"), class = "factor"), Rep = c(1L, 
    2L, 3L, 1L, 2L, 3L, 1L, 2L, 3L, 1L, 2L, 3L), Meas = c(3L, 
    2L, 2L, 2L, 6L, 4L, 4L, 3L, 5L, 1L, 2L, 3L), SD = c(2L, 3L, 
    2L, 2L, 2L, 3L, 2L, 3L, 3L, 3L, 2L, 1L)), .Names = c("Treatment", 
"Temp", "Rep", "Meas", "SD"), row.names = c(NA, -12L), class = "data.frame")

ggplot(dat, aes(x = Treatment, y = Meas, ymin = Meas - SD/2, ymax = Meas + SD/2)) +
geom_linerange(aes(color = Temp), position=position_dodge(width=c(0.6,0.4)), size = 1, alpha = 0.5) +
geom_point(aes(color = Temp, shape = Temp), position=position_dodge(width=c(0.6,0.4)), size = 3) +
theme_bw()

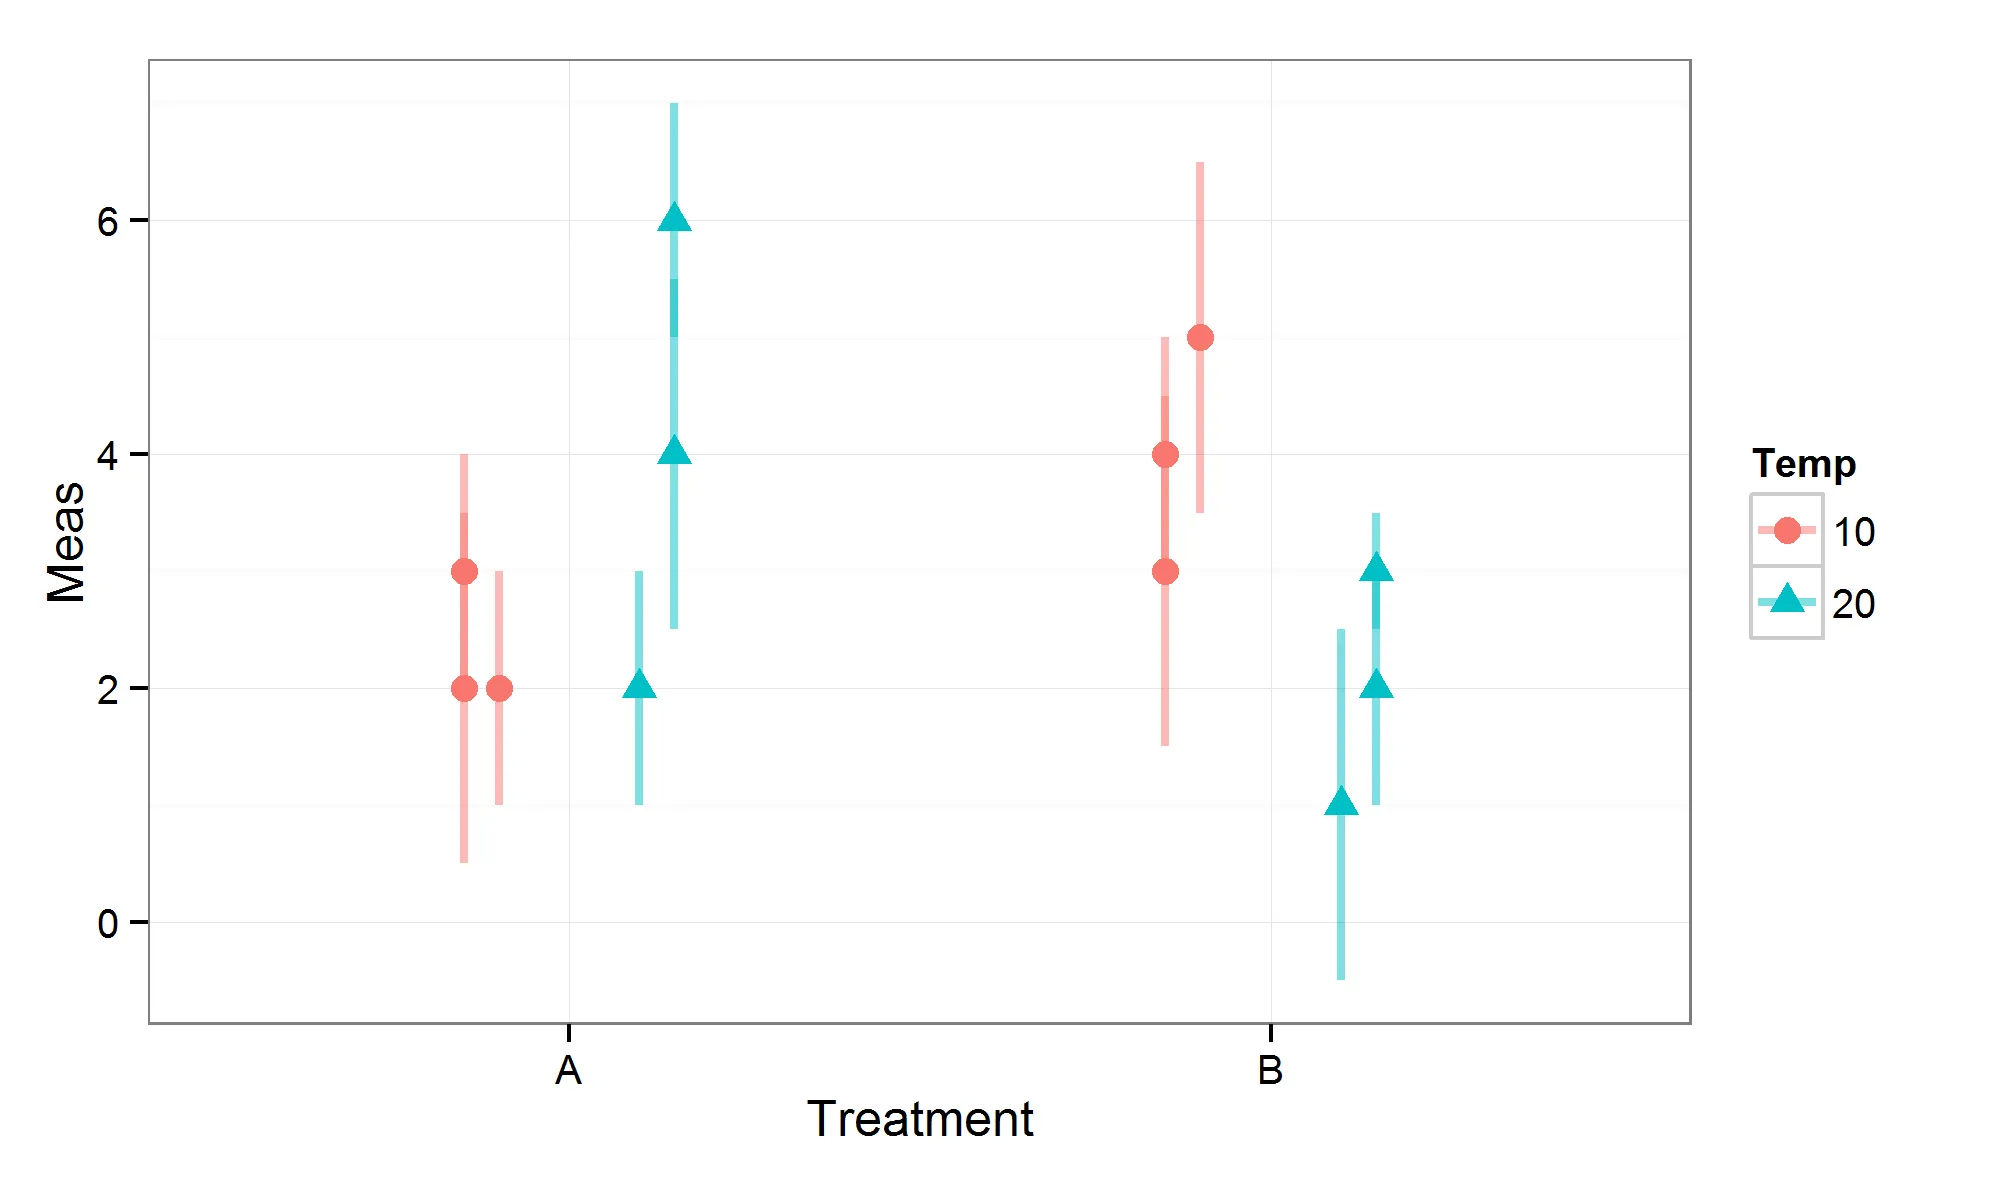
这导致产生下面所示的图。然而,并非所有点都被闪避,我必须在Illustrator中移动点和误差线,以得到上面所示的图。是否有一种方法可以在两个层次上使用ggplot2的闪避参数? enter image description here


5
+1!为什么这里会有负评?! - agstudy
1
有趣的问题,如果将
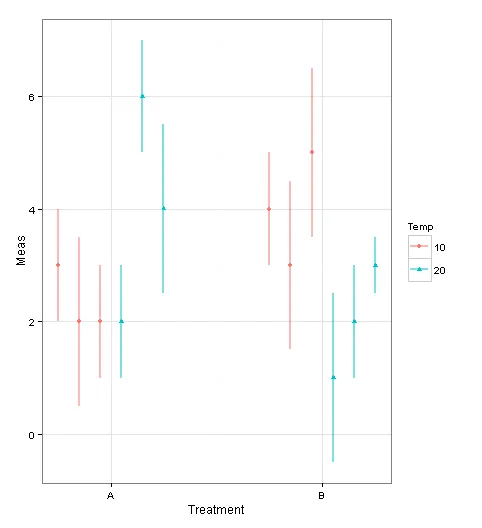
Rep指定为分组变量,则可以获得稍微更好的结果,例如ggplot(dat, aes(x = Treatment, y = Meas, ymin = Meas - SD/2, ymax = Meas + SD/2, group = Rep)),但仍不是最佳选择。此外,您还可以通过使用geom_pointrange来简化调用,例如geom_pointrange(aes(color = Temp, shape = Temp), position=position_dodge(width=c(0.6,0.4)), size = 1, alpha = 0.7) - Andy W
3个回答

5

从逻辑上讲,position_dodge 更适用于条形图。它确实可以在一个因子水平上与 lineranges 一起使用,但是在第二个水平上难以定义线之间的最小距离。虽然您可以对因子进行数字区分,然后为标签添加适当的位置。

dat1<-cbind(dat,aux=rep(1,length(dat[,1]))) 
dat1<-within(dat1, {aux = unlist(by(aux,Treatment,cumsum))})
dat1$aux<-dat1$aux+as.numeric(dat1$Treatment)*10
ggplot(dat1, aes( x=aux, y = Meas, ymin = Meas - SD/2, ymax = Meas + SD/2)) +
geom_linerange(aes(color = Temp), size = 1, alpha = 0.5) +geom_point(aes(color = Temp, shape = Temp))+
scale_x_continuous("Treatment",breaks=c(13.5,23.5), labels=c("A","B")) + # here you define coordinates for A and B 
theme_bw()

enter image description here


我认为,您也可以在lineranges中使用position_dodge。关键是它将通过Treatment对值(按colour分组)进行躲避,而OP还需要在其中进行躲避。也就是说,如果Temp=10Temp=20只有1个值,那么dodge就可以正常工作。 - Arun
使用Temp因子进行闪避没有问题。问题在于所有的lineranges都被合并在一起了。为了防止这种情况,我为每个观测值使用了不同的因子。当我们对Treatment因子进行闪避时,我们根据A和B两侧的X坐标设置了一些间距。每条线也有确切的X坐标,但是你不能对第二个因子进行闪避,即使为每条线分别使用不同的因子进行分组也无济于事。 - user974514
是的,我明白了。我只是在写关于你的第一和第二行的内容。 - Arun

2

这不会解决position_dodge()的问题,但可以作为该问题的解决方法。

在您原始的数据框中添加了新变量x。它包含点/线范围的x坐标。数据框中的值应按您想要绘制它们的顺序排列。

dat$x<-c(0.85,0.9,0.95,1.05,1.1,1.15,1.85,1.9,1.95,2.05,2.1,2.15)

现在将这个新变量用作 x 值,并使用 scale_x_continuous() 设置断点和标签,以便在刻度上获取 AB
ggplot(dat, aes(x = x, y = Meas, ymin = Meas - SD/2, ymax = Meas + SD/2)) +
  geom_linerange(aes(color = Temp), size = 1, alpha = 0.5) +
  geom_point(aes(color = Temp, shape = Temp), size = 3) +
  theme_bw()+
  scale_x_continuous("Treatment",breaks=c(1,2),labels=c("A","B"),limits=c(0.5,2.5))

1

虽然有些过时,但如果有人像我一样在寻找答案,我的同事向我展示了如何使用交互制作组美学,方法如下:

dat <- structure(list(Treatment = structure(c(1L, 1L, 1L, 1L, 1L, 1L, 
                                              2L, 2L, 2L, 2L, 2L, 2L), .Label = c("A", "B"), class = "factor"), 
                      Temp = structure(c(1L, 1L, 1L, 2L, 2L, 2L, 1L, 1L, 1L, 2L, 
                                         2L, 2L), .Label = c("10", "20"), class = "factor"), Rep = c(1L, 
                                                                                                     2L, 3L, 1L, 2L, 3L, 1L, 2L, 3L, 1L, 2L, 3L), Meas = c(3L, 
                                                                                                                                                           2L, 2L, 2L, 6L, 4L, 4L, 3L, 5L, 1L, 2L, 3L), SD = c(2L, 3L, 
                                                                                                                                                                                                               2L, 2L, 2L, 3L, 2L, 3L, 3L, 3L, 2L, 1L)), .Names = c("Treatment", 
                                                                                                                                                                                                                                                                    "Temp", "Rep", "Meas", "SD"), row.names = c(NA, -12L), class = "data.frame")

ggplot(dat, aes(x = Treatment, y = Meas, ymin = Meas - SD/2, ymax = Meas + SD/2)) +
  geom_linerange(aes(color = Temp, group = interaction(Rep, Temp)), position=position_dodge(width=c(0.6)), size = 1, alpha = 0.5) +
  geom_point(aes(color = Temp, shape = Temp, group = interaction(Rep, Temp)), position=position_dodge(width=c(0.6)), size = 3) +
  theme_bw()  

网页内容由stack overflow 提供, 点击上面的
可以查看英文原文,
原文链接