如何根据crosstalk条件动态更改Plotly轴

5
这个问题之前已经被问过,但因为没有reprex而没有得到答案,所以让我来试一下。
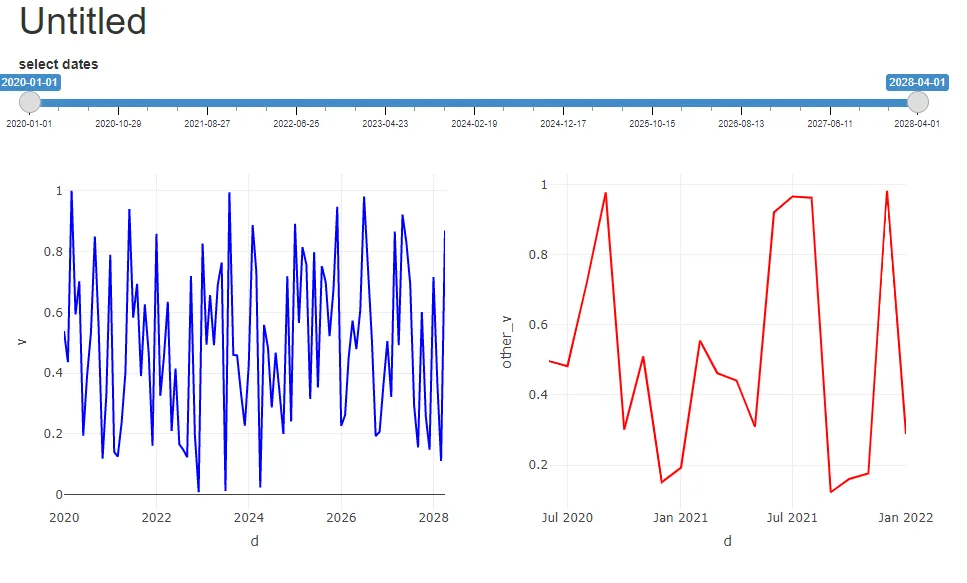
假设我有两个跨越不同日期范围的数据集。我想使用滑块控制每个可视化效果。以下reprex将创建直接下方的可视化效果。
---
title: "Untitled"
output: html_document
---

```{r setup, include=FALSE}
knitr::opts_chunk$set(echo = FALSE)

#+ message = FALSE, warning = FALSE
library(plotly)
library(crosstalk)
library(dplyr)
#+
```

```{r}
df1 <- data.frame(d = seq.Date(from = as.Date("2020-01-01"), by = "months", length.out = 100), v = runif(100))
df2 <- data.frame(d = seq.Date(from = as.Date("2020-6-01"), by = "months", length.out = 20), other_v = runif(20))

both_df <- full_join(df1, df2, by = 'd')

both_df_sh <- both_df %>% SharedData$new(group = "boom")

selector <- filter_slider(id = "selector1", label = "select dates", sharedData = both_df_sh, column = ~d)

v_p <- both_df_sh %>% plot_ly(x = ~d) %>% add_lines(y = ~v, name = "v", color = I("blue"))

other_v_p <- both_df_sh %>% plot_ly(x = ~d) %>% add_lines(y = ~other_v, name = "other v", color = I("red"))
```

```{r}
crosstalk::bscols(v_p, other_v_p)
```

enter image description here

这是正确的,因为两个图表都正确显示了它们的日期范围。然而,我的客户希望在图表中看到空白,如果该范围没有数据。类似于这样:
---
title: "Untitled"
output: html_document
---

```{r setup, include=FALSE}
knitr::opts_chunk$set(echo = FALSE)

#+ message = FALSE, warning = FALSE
library(plotly)
library(crosstalk)
library(dplyr)
#+
```

```{r}
df1 <- data.frame(d = seq.Date(from = as.Date("2020-01-01"), by = "months", length.out = 100), v = runif(100))
df2 <- data.frame(d = seq.Date(from = as.Date("2020-6-01"), by = "months", length.out = 20), other_v = runif(20))

both_df <- full_join(df1, df2, by = 'd')

both_df_sh <- both_df %>% SharedData$new(group = "boom")

selector <- filter_slider(id = "selector1", label = "select dates", sharedData = both_df_sh, column = ~d)

v_p <- both_df_sh %>% plot_ly(x = ~d) %>% add_lines(y = ~v, name = "v", color = I("blue")) %>% 
  layout(xaxis = list(range = list(min(both_df_sh$data()$d, na.rm = TRUE), 
                            max(both_df_sh$data()$d, na.rm = TRUE))))

other_v_p <- both_df_sh %>% plot_ly(x = ~d) %>% add_lines(y = ~other_v, name = "other v", color = I("red")) %>% 
  layout(xaxis = list(range = list(min(both_df_sh$data()$d, na.rm = TRUE), 
                            max(both_df_sh$data()$d, na.rm = TRUE))))
```

```{r}
selector
```

```{r}
crosstalk::bscols(v_p, other_v_p)
```

正如预期的那样,它给了我们以下内容: 输入图像描述

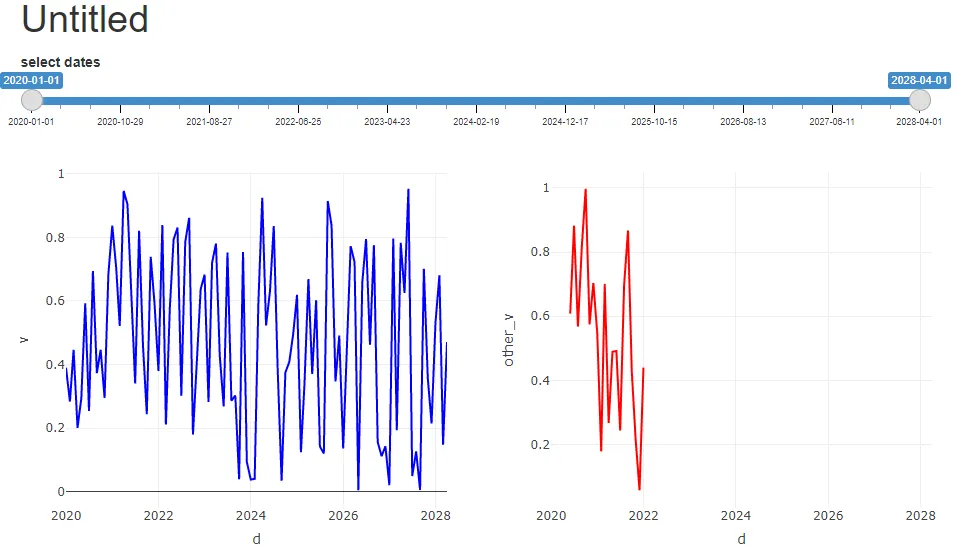
这就是我想要的!然而,现在,图表不再随着filter_select缩放,它只隐藏数据,这并不会产生美观的视觉效果: 输入图像描述

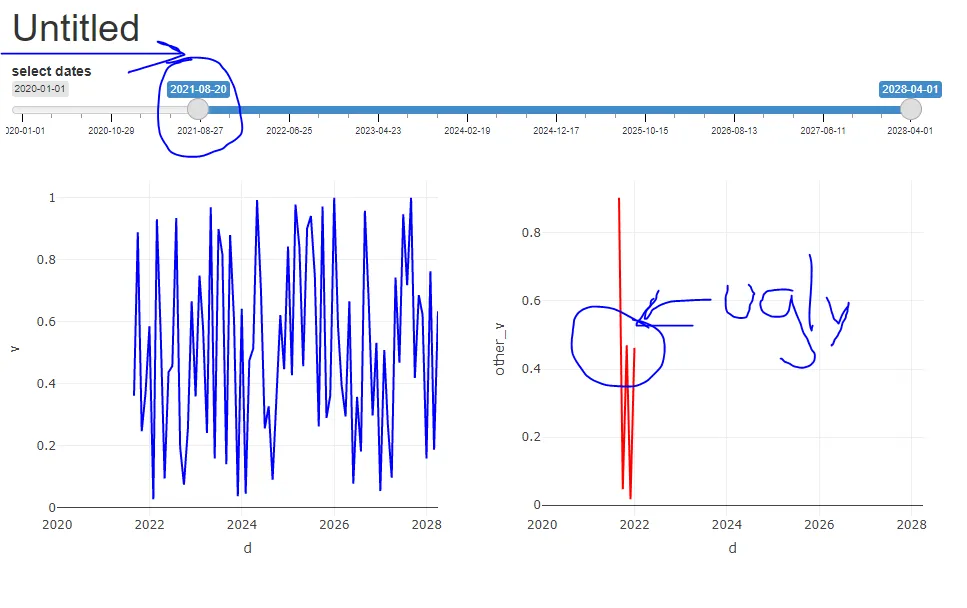
因此,当拖动条时,我希望图表限制可以“滑动”...但要做到这一点,我需要在那个时候得到filter_select的值。

我认为我可以通过像这样更改限制来事先获取它:

selector_values <- jsonlite::fromJSON(selector$children[[3]]$children[[1]])$values

v_p <- both_df_sh %>% plot_ly(x = ~d) %>% add_lines(y = ~v, name = "v", color = I("blue")) %>% 
  layout(xaxis = list(range = min(selector_values), max(selector_values)))

other_v_p <- both_df_sh %>% plot_ly(x = ~d) %>% add_lines(y = ~other_v, name = "other v", color = I("red")) %>% 
  layout(xaxis = list(range = min(selector_values), max(selector_values)))

但是在仪表板启动后,这些值不会被重新评估。我需要一种访问这些选择器的当前值的方法...我该怎么做?

1个回答

5
我们可以使用Plotly的matches参数来对齐多个图表的坐标轴,就像我在这里所做的那样:
---
title: "Untitled"
output: html_document
---

```{r setup, include=FALSE}
knitr::opts_chunk$set(echo = FALSE)

#+ message = FALSE, warning = FALSE
library(plotly)
library(crosstalk)
library(dplyr)
#+
```

```{r}
df1 <- data.frame(d = seq.Date(from = as.Date("2020-01-01"), by = "months", length.out = 100), v = runif(100))
df2 <- data.frame(d = seq.Date(from = as.Date("2020-6-01"), by = "months", length.out = 20), other_v = runif(20))

both_df <- full_join(df1, df2, by = 'd')

both_df_sh <- both_df %>% SharedData$new(group = "boom")

selector <- filter_slider(id = "selector1", label = "select dates", sharedData = both_df_sh, column = ~d)

v_p <- both_df_sh %>% plot_ly(x = ~d) %>% add_lines(y = ~v, name = "v", color = I("blue"))

other_v_p <- both_df_sh %>% plot_ly(x = ~d) %>% add_lines(y = ~other_v, name = "other v", color = I("red")) %>% layout(xaxis = list(matches = "x"))
```

```{r}
selector
```

```{r, out.width='100%'}
subplot(v_p, other_v_p, shareX = TRUE, shareY = TRUE)
```

result


我不确定我是否正确理解了您期望的输出,但如果您想自动缩放x轴,请删除x轴的range(即layout()调用)。crosstalk将负责提供基于filter_slider的筛选数据:
---
title: "Untitled"
output: html_document
---

```{r setup, include=FALSE}
knitr::opts_chunk$set(echo = FALSE)

#+ message = FALSE, warning = FALSE
library(plotly)
library(crosstalk)
library(dplyr)
#+
```

```{r}
df1 <- data.frame(d = seq.Date(from = as.Date("2020-01-01"), by = "months", length.out = 100), v = runif(100))
df2 <- data.frame(d = seq.Date(from = as.Date("2020-6-01"), by = "months", length.out = 20), other_v = runif(20))

both_df <- full_join(df1, df2, by = 'd')

both_df_sh <- both_df %>% SharedData$new(group = "boom")

selector <- filter_slider(id = "selector1", label = "select dates", sharedData = both_df_sh, column = ~d)

v_p <- both_df_sh %>% plot_ly(x = ~d) %>% add_lines(y = ~v, name = "v", color = I("blue"))

other_v_p <- both_df_sh %>% plot_ly(x = ~d) %>% add_lines(y = ~other_v, name = "other v", color = I("red"))
```

```{r}
selector
```

```{r}
crosstalk::bscols(v_p, other_v_p)
```

result

一种非串扰的方法,使用共享的x轴和范围滑块:
library(plotly)
library(dplyr)

df1 <- data.frame(d = seq.Date(from = as.Date("2020-01-01"), by = "months", length.out = 100), v = runif(100))
df2 <- data.frame(d = seq.Date(from = as.Date("2020-6-01"), by = "months", length.out = 20), other_v = runif(20))

both_df <- full_join(df1, df2, by = 'd')

fig1 <- plot_ly(both_df, x = ~ d, y = ~ v, type = "scatter", mode = "lines")
fig2 <- plot_ly(both_df, x = ~ d, y = ~ other_v, type = "scatter", mode = "lines") 

fig_shared_x <- subplot(fig1, fig2, nrows = 2, shareX = TRUE)
fig_shared_x

fig_rangeslider <- fig_shared_x %>% layout(xaxis = list(rangeslider = list(type = "date")))
fig_rangeslider

result


1
@AmitKohli 我现在明白了。请查看我编辑后使用xaxis参数“matches”的帖子顶部。 - ismirsehregal
那个滑块在Ploly中不起作用吗?它看起来很漂亮! - Amit Kohli
1
当然 - rangeslider 在 RMarkdown 文档中也可以工作。我只是想减少代码量。 - ismirsehregal
我猜没有subplot,你需要编写一些自定义JS。你可以使用Plotly.relayout来同步轴,并通过htmlwidgets::onRender将JS代码传递给plotly对象(请参见此处)。但是,仅为了保持某种风格就需要做很多工作。 - ismirsehregal
1
是的 - 使用独立的HTML文件做事情有点困难(在shiny上下文中会更容易)。关于标题,请查看我在此处的答案[https://dev59.com/MLfna4cB1Zd3GeqP0-fA#59191142](也适用于不使用`shiny`)。 - ismirsehregal
显示剩余5条评论

网页内容由stack overflow 提供, 点击上面的
可以查看英文原文,
原文链接