我正在尝试在ggplot2中创建一条折线图,其中某些变量使用不同的线型,另一些变量使用不同的标记。
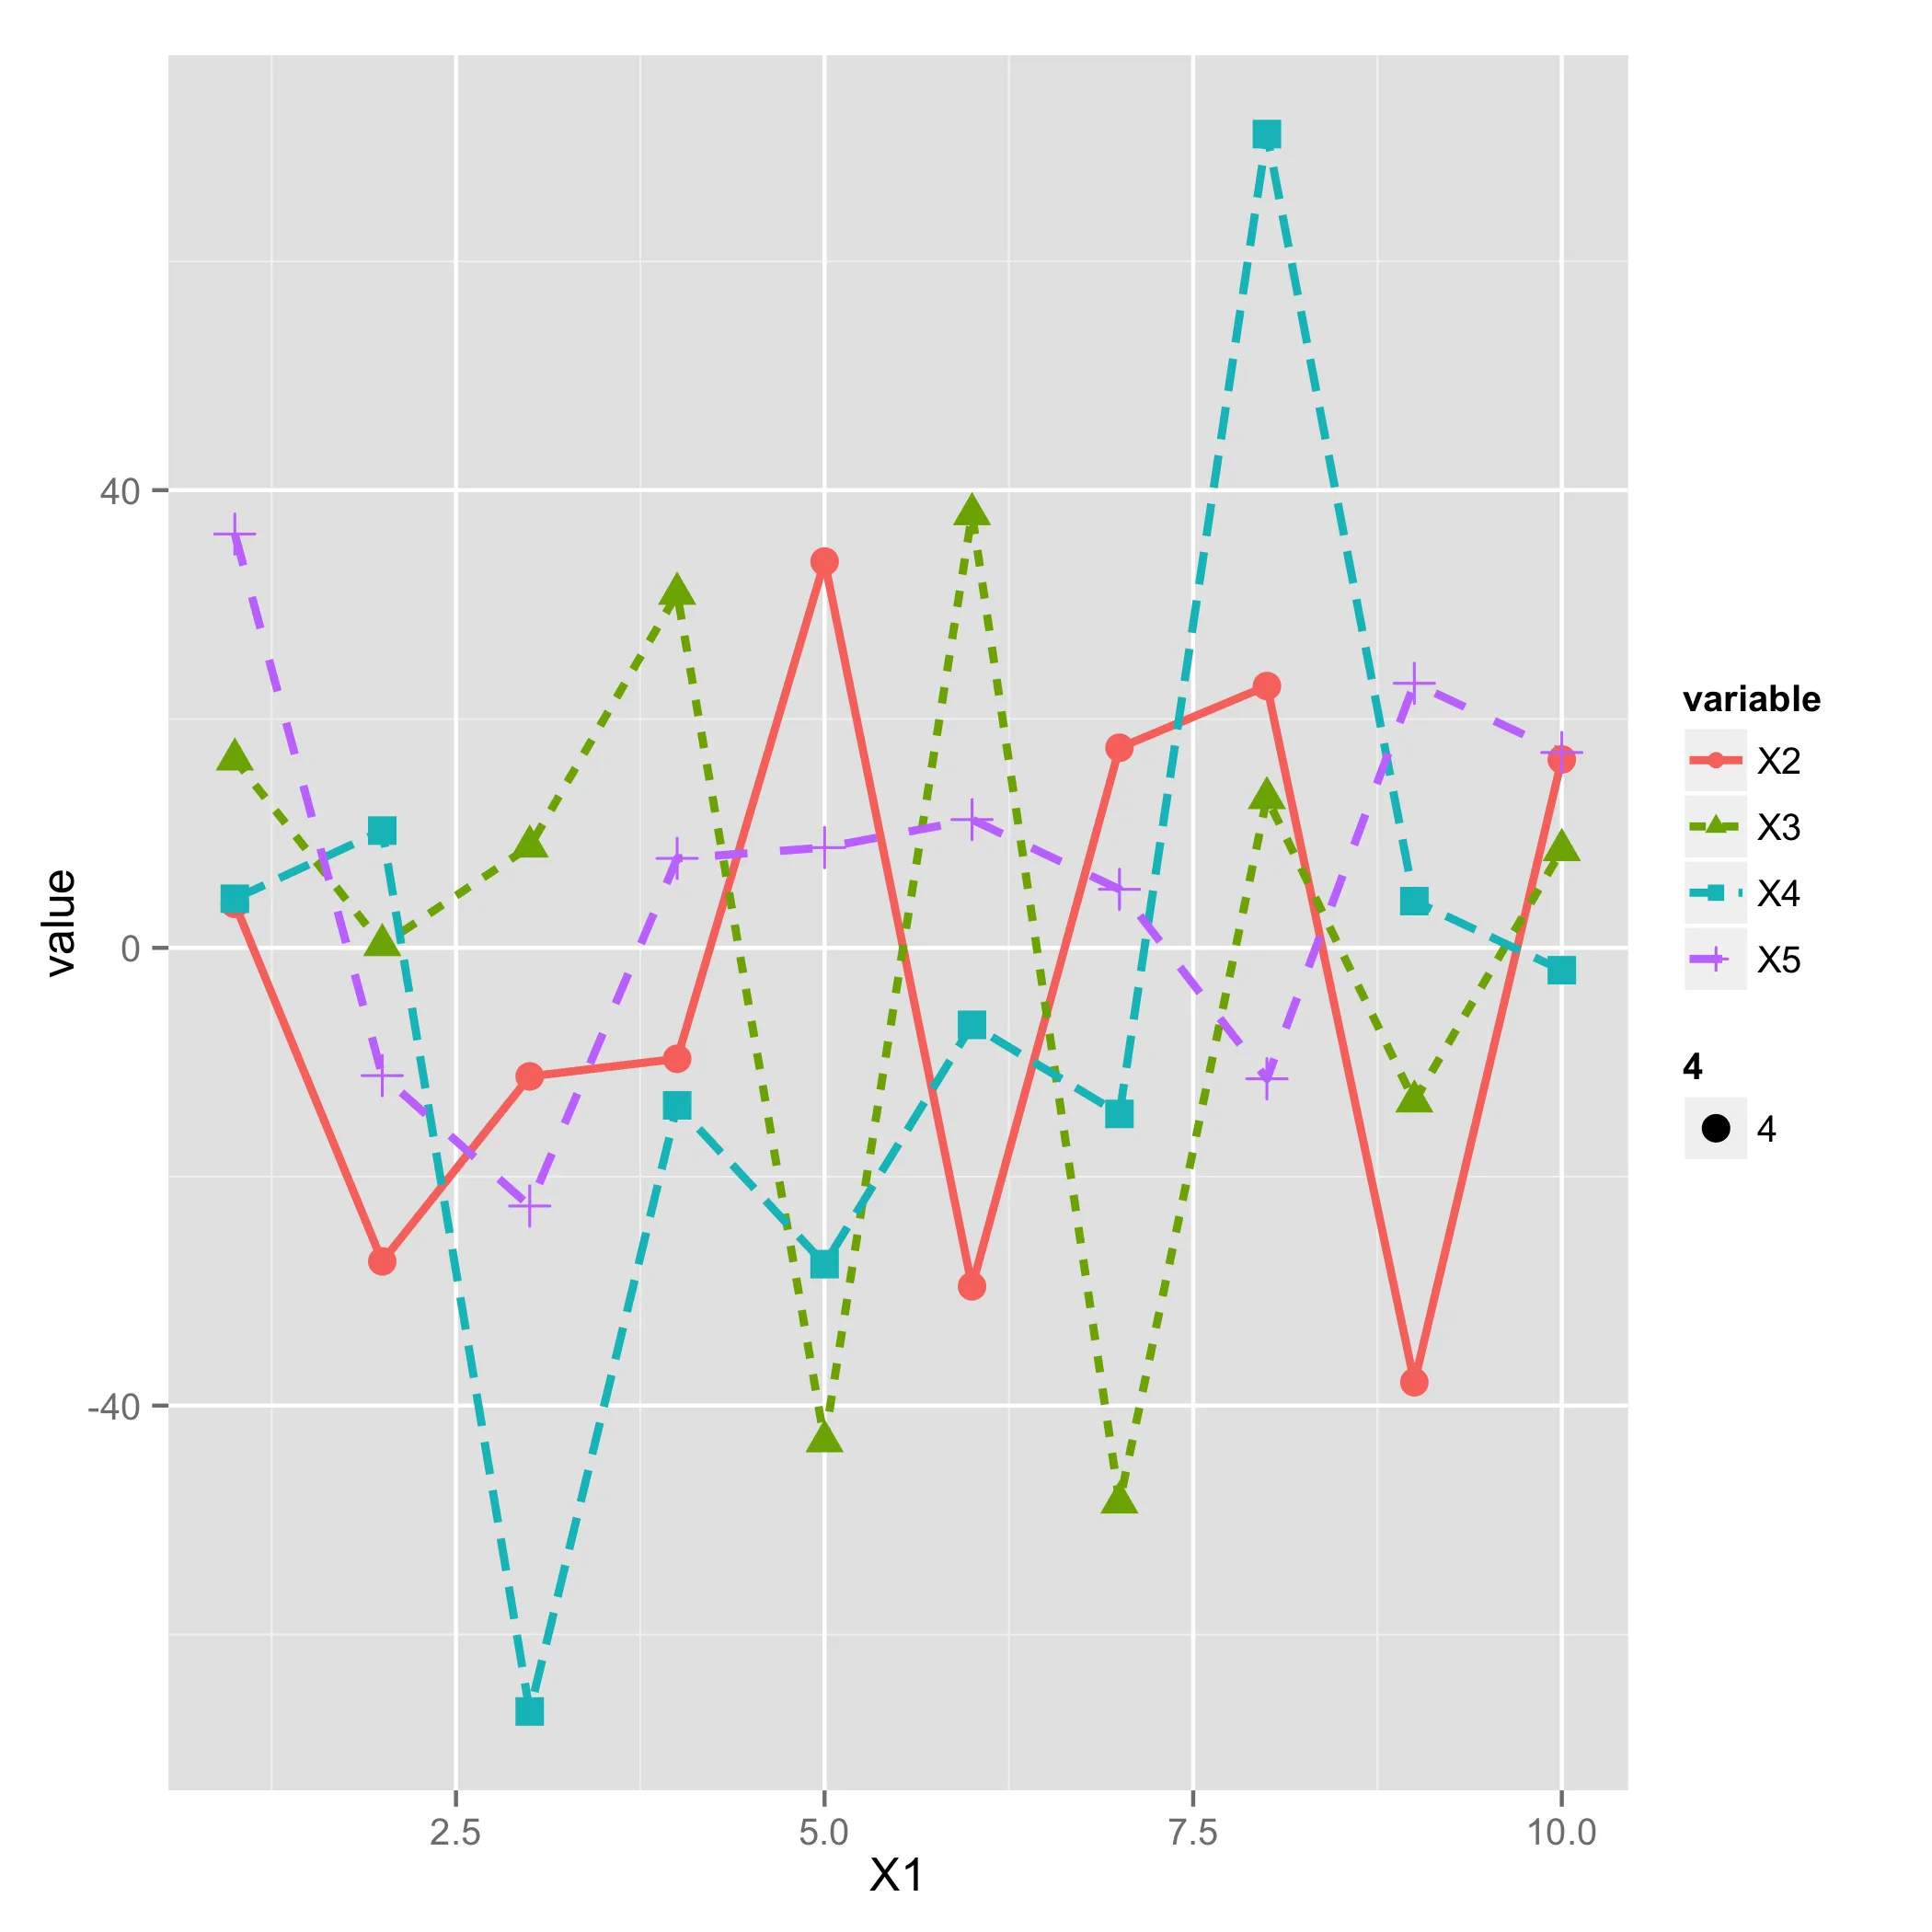
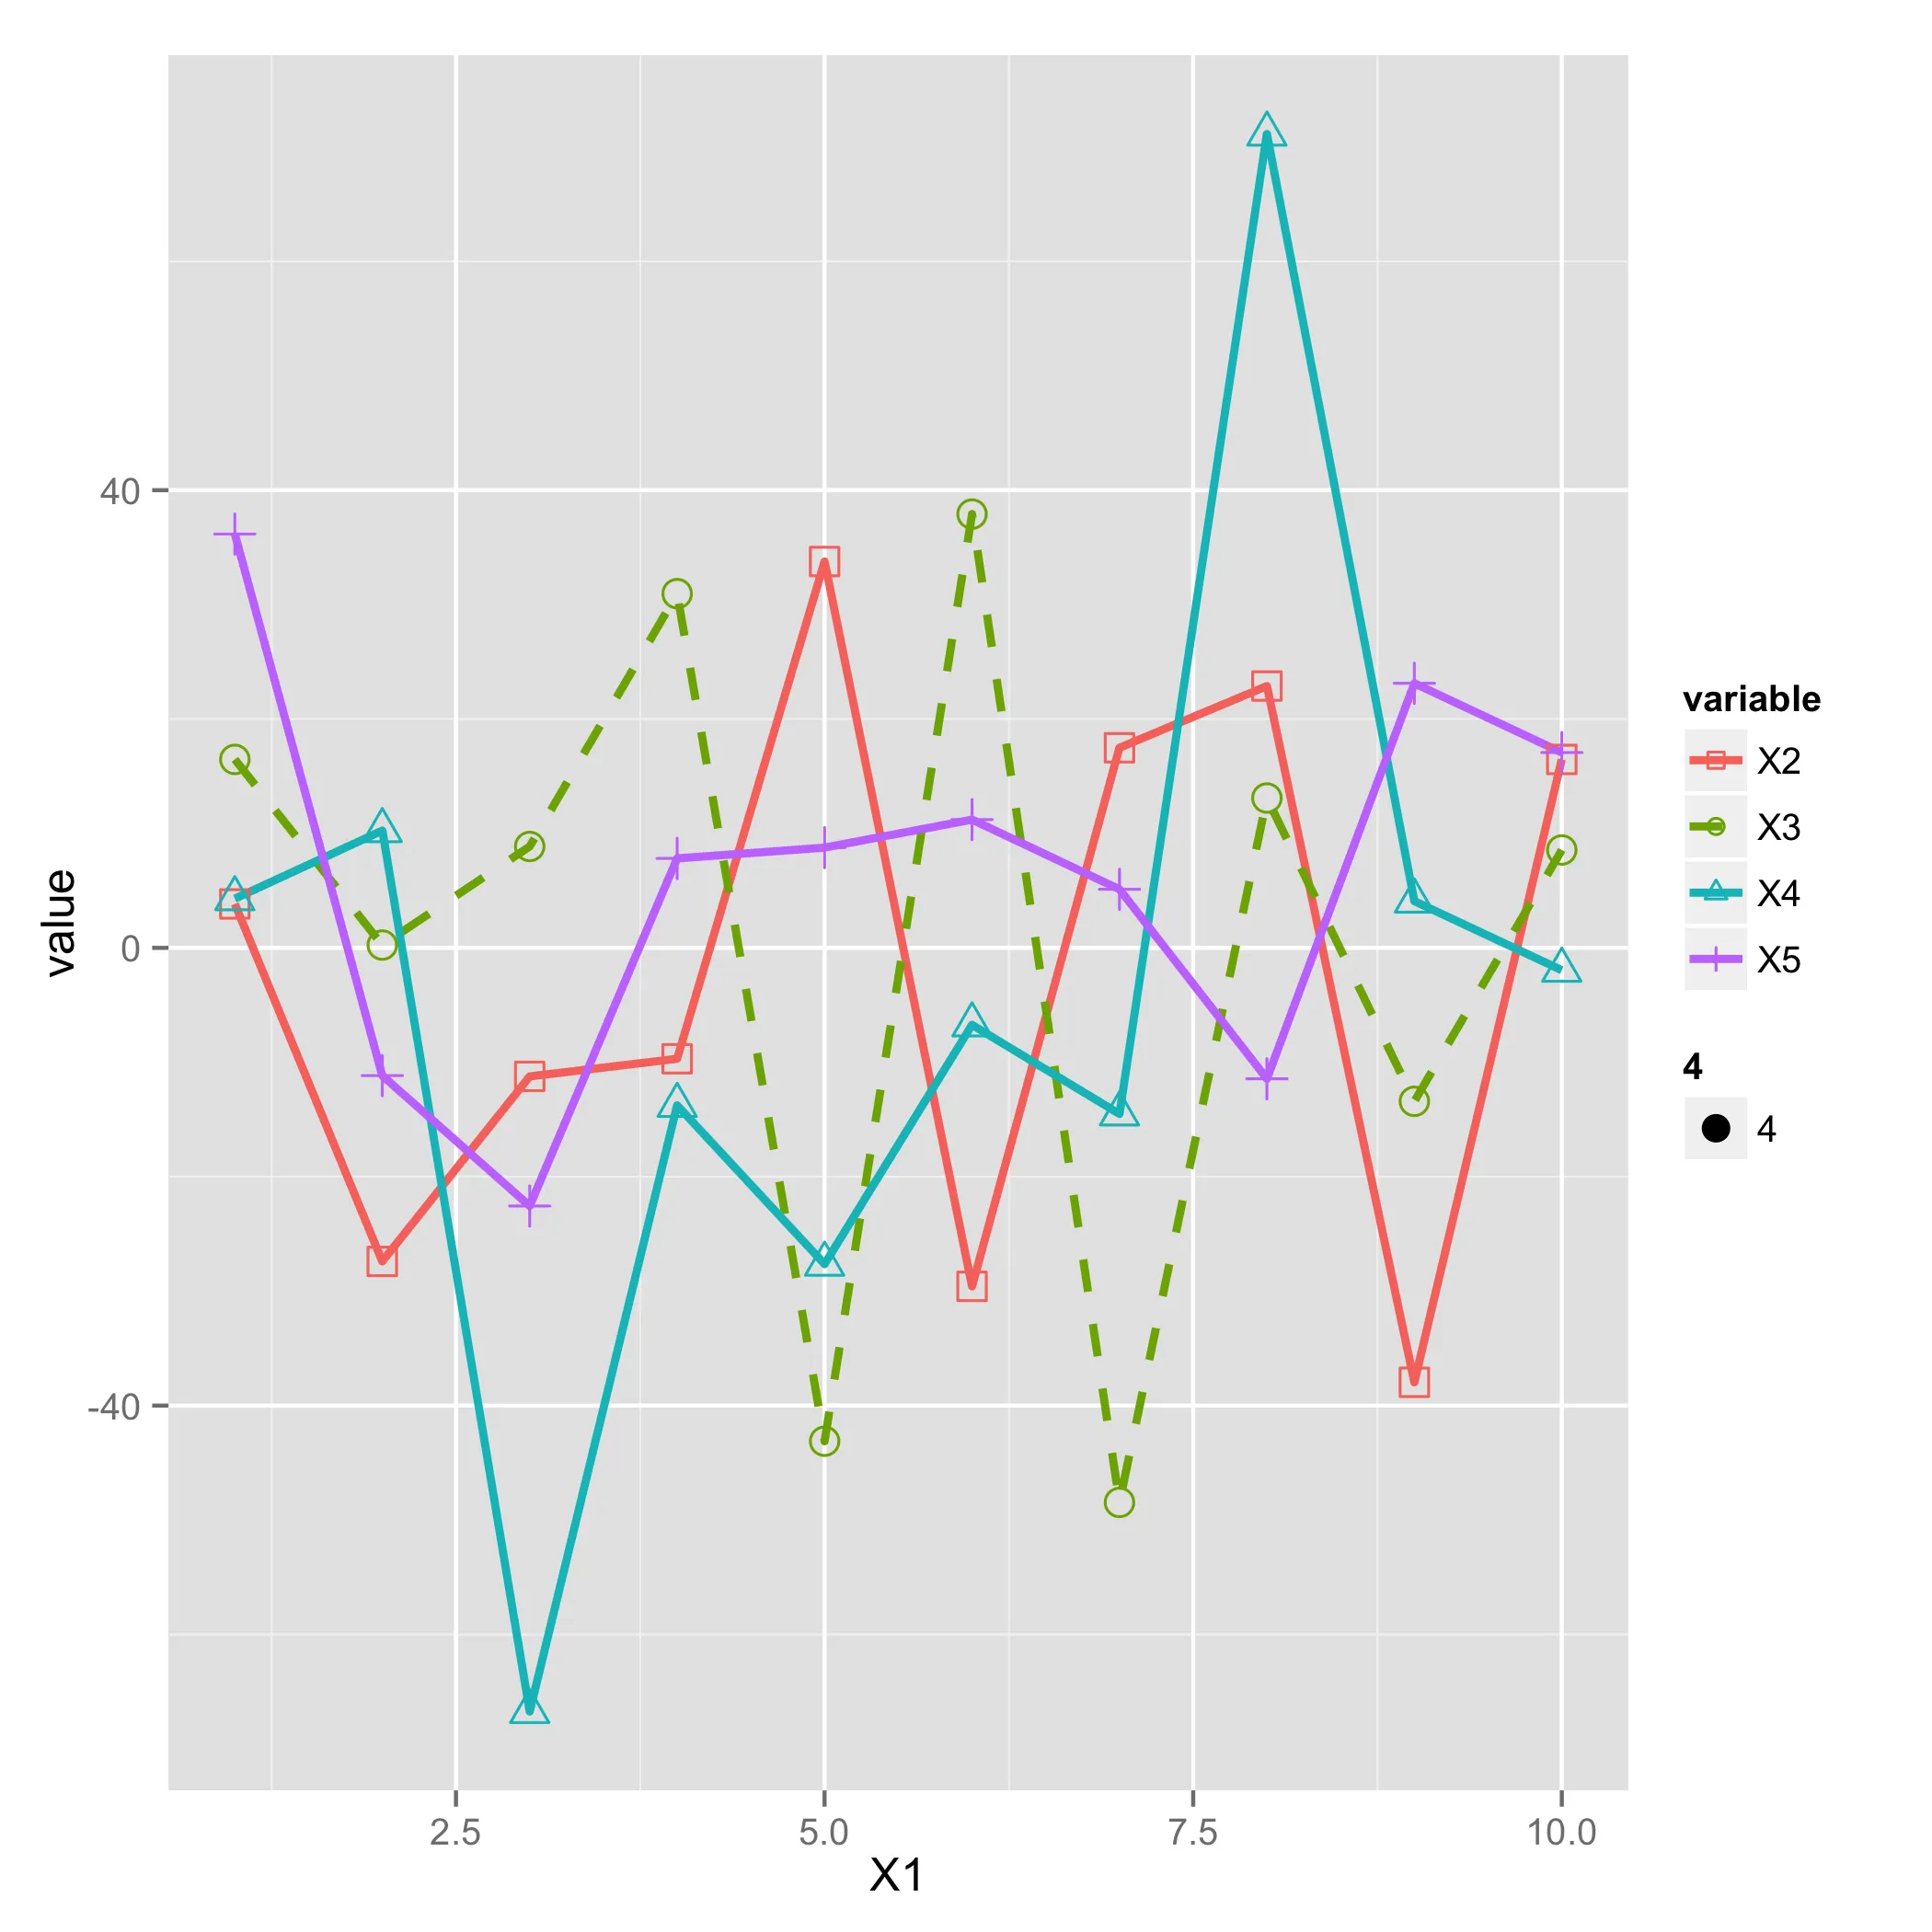
示例1:每个变量使用不同的线型绘制;示例2:每个变量使用不同的标记绘制;示例3:每个变量使用不同的线型和标记绘制。
我希望将X2和X3绘制成不同的线型(实线、虚线),然后将X4和X5绘制成实线,并使用不同的标记(圆形、正方形等等)。
是否有任何方法可以做到这一点?
library(ggplot2)
library(reshape2)

set.seed <- 1
df <- data.frame(cbind(seq(1,10,1),matrix(rnorm(100,1,20), 10, 4)))
d <- melt(df, id="X1")

# Example 1: different line styles
ggplot(d, aes(x=X1, y=value, color=variable)) +
  geom_line(aes(linetype=variable), size=1)

# Example 2: different markers for each line
ggplot(d, aes(x=X1, y=value, color=variable)) +
  geom_line() + geom_point(aes(shape=variable, size=4))

# Example 3: differnt line styles & different markers (You see this graph below)
ggplot(d, aes(x=X1, y=value, color=variable)) +
  geom_line(aes(linetype=variable), size=1) +
  geom_point(aes(shape=variable, size=4))