如何使用ggplot绘制每行标准差的折线图

4

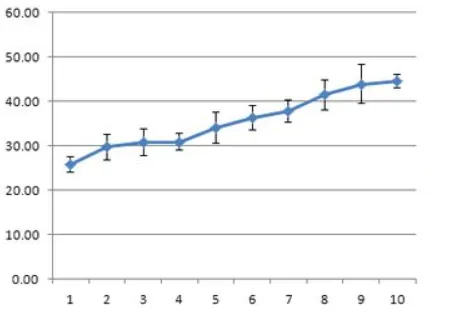
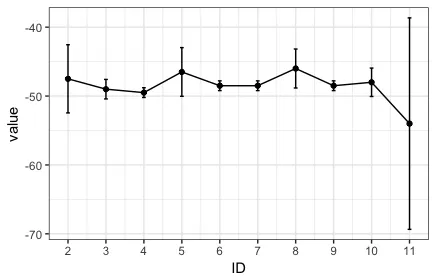
我想绘制一个图表,其中每行(第一列的值除外)的中位数为y轴,标准差为误差条。结果应该看起来类似于这样的图:

enter image description here

我有一个像这样的数据框:

myTable <- "
        1     -50     -52
        2     -44     -51
        3     -48     -50
        4     -50     -49
        5     -44     -49
        6     -48     -49
        7     -48     -49
        8     -44     -48
        9     -49     -48
       10     -48     -45
       11     -60     -48
       10     -50     -48
       11     -80     -47"
df <- read.table(text=myTable, header = TRUE)
df <- c("ID","Value1","Value2");

我的数据存储在一个.csv文件中,我用以下代码来加载它:

df <- read.csv(file="~/path/to/myFile.csv", header=FALSE, sep=",")

1
你有两列数据,想要取出成对的中位数?然后计算这些数字对的标准差?从统计学的角度来看,这似乎有点奇怪。你的真实数据是否有更多的列呢? - MrFlick
是的,我的真实数据有20列带有值。 - schande
df <- c("ID","Value1","Value2") should be names(df) <- c("ID","Value1","Value2") - eipi10
这个改变有什么影响? - schande
在运行 df <- read.table(text=myTable, header = TRUE) 后,在控制台中输入 df,然后在运行 df <- c("ID","Value1","Value2") 后再次输入 df - eipi10
1个回答

4
下面的代码创建了一个辅助函数,用于提供绘图所需的中位数和标准差值。在绘图之前,我们还将数据转换为“长”格式。
library(tidyverse)
theme_set(theme_bw())

df <- read.table(text=myTable, header = TRUE)
names(df) <- c("ID","Value1","Value2")

median_sd = function(x, n=1) {
  data_frame(y = median(x),
             sd = sd(x),
             ymin = y - n*sd,
             ymax = y + n*sd)
}

ggplot(df %>% gather(key, value, -ID), aes(ID, value)) +
  stat_summary(fun.data=median_sd, geom="errorbar", width=0.1) +
  stat_summary(fun.y=median, geom="line") +
  stat_summary(fun.y=median, geom="point") +
  scale_x_continuous(breaks=unique(df$ID))

enter image description here

如果你经常需要这样做,以下代码可以避免使用辅助函数,但是保留这个函数还是很方便的。

ggplot(df %>% gather(key, value, -ID), aes(ID, value)) +
  stat_summary(fun.y=median, fun.ymin=function(x) median(x) - sd(x), 
               fun.ymax=function(x) median(x) + sd(x), geom="errorbar", width=0.1) +
  stat_summary(fun.y=median, geom="line") +
  stat_summary(fun.y=median, geom="point") +
  scale_x_continuous(breaks=unique(df$ID))

它绘制了中位数的图表,但没有误差条,我得到了以下错误:Error in UseMethod("gather_") : no applicable method for 'gather_' applied to an object of class "function" - schande
1
你是否安装并加载了 tidyverse 包? - eipi10
是的,我甚至将 library(tidyverse) 放在代码之前。 - schande
1
你是在运行你问题中的示例数据还是你实际的数据?如果是后者,没有看到你实际数据和你正在运行的实际代码的样本可能很难确定出现了什么问题。 - eipi10
我的数据中有一个错位的单元格。你的解决方案现在非常有效!谢谢。 - schande

网页内容由stack overflow 提供, 点击上面的
可以查看英文原文,
原文链接