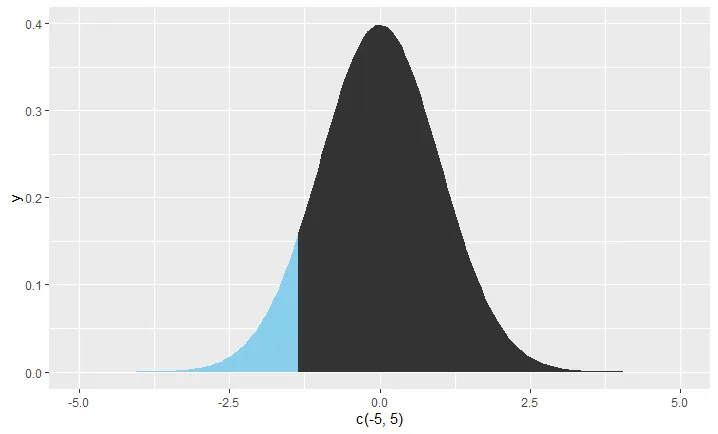
我找到了一种方法来“黑客”ggplot,通过组合两个geom_area图形来创建一个带有尾部区域的正态分布:
library(ggplot2)
mean <-  0
standard_deviation <- 1
Zscore <- -1.35

observation = (Zscore*standard_deviation) + mean
(tail_area <- round(pnorm(observation),2))

ggplot(NULL, aes(c(-5,5))) +
    geom_area(stat = "function", fun = dnorm, fill="sky blue", xlim = c(-5, -1.35)) +
    geom_area(stat = "function", fun = dnorm,  xlim = c(-1.35, 5))