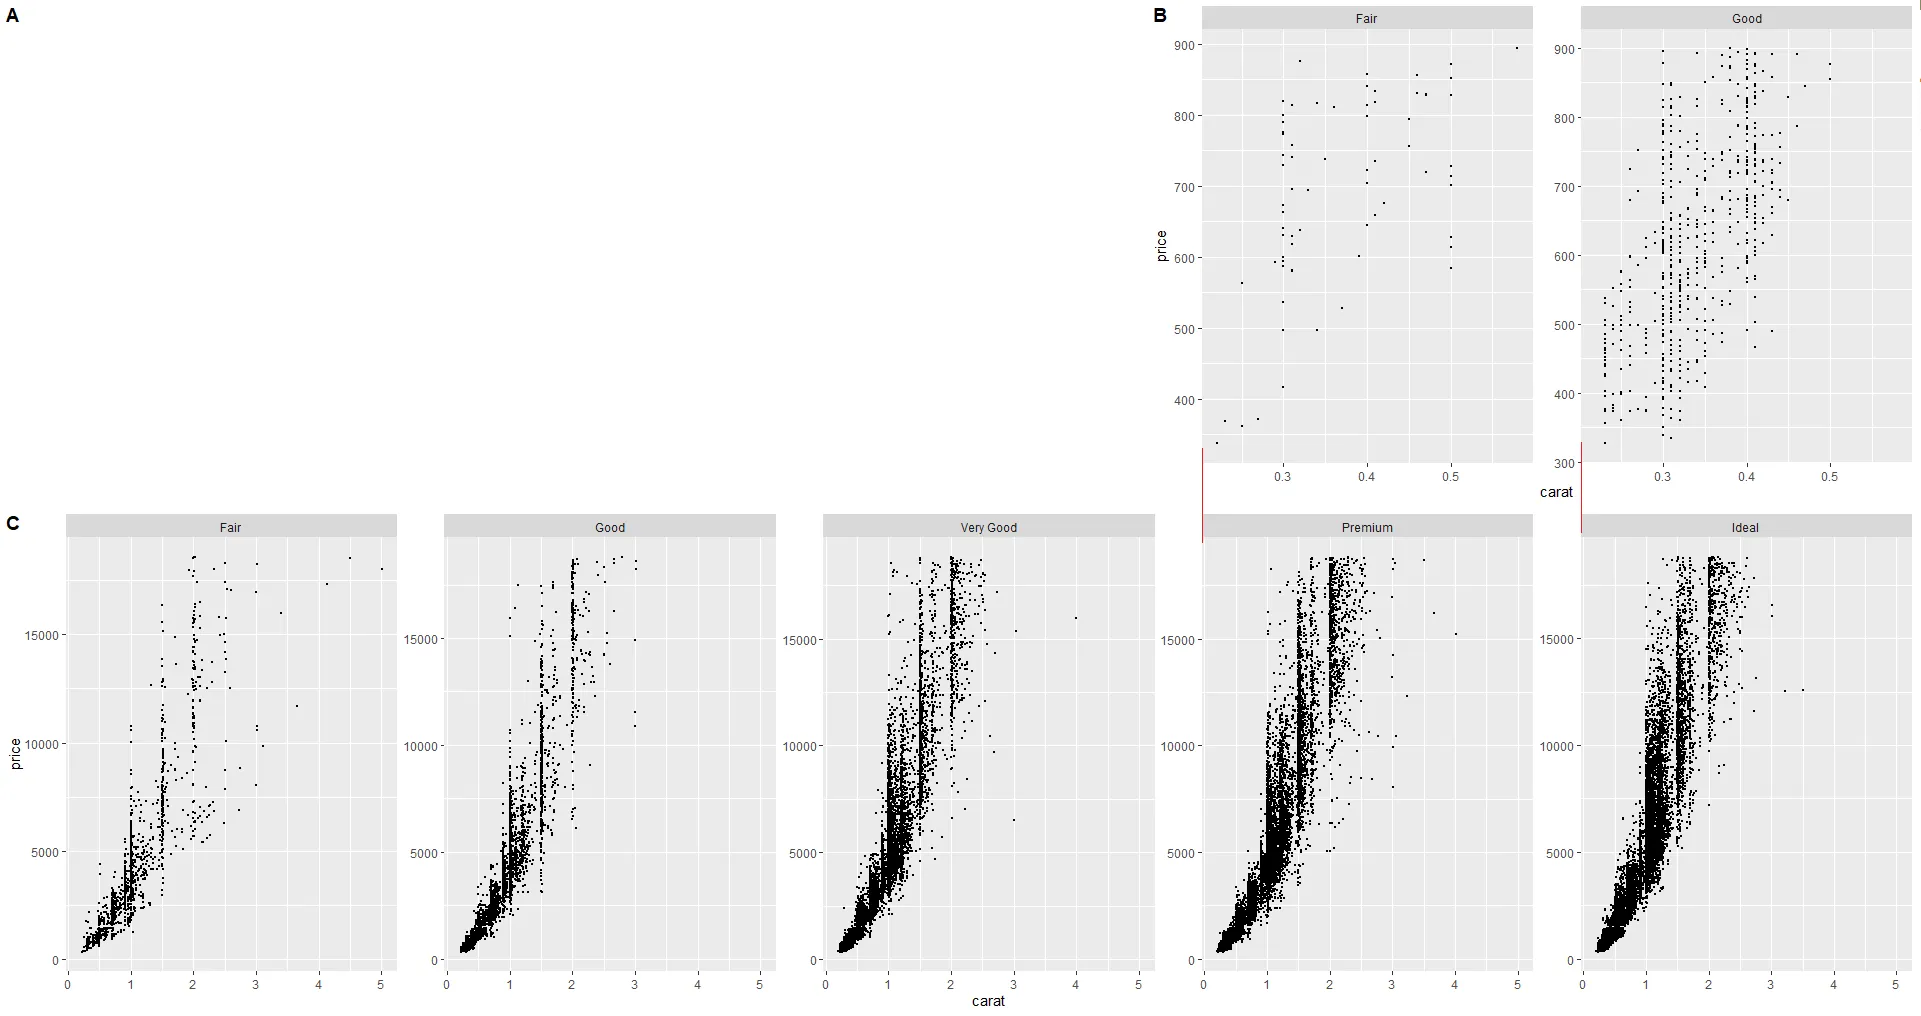
在R中使用cowplot对分面ggplots(facet_wrap)进行对齐

5
我正在尝试通过ggplot中的facet_wrap生成两个面板图,并以以下方式对齐它们(注意:面板A需要保持空白):
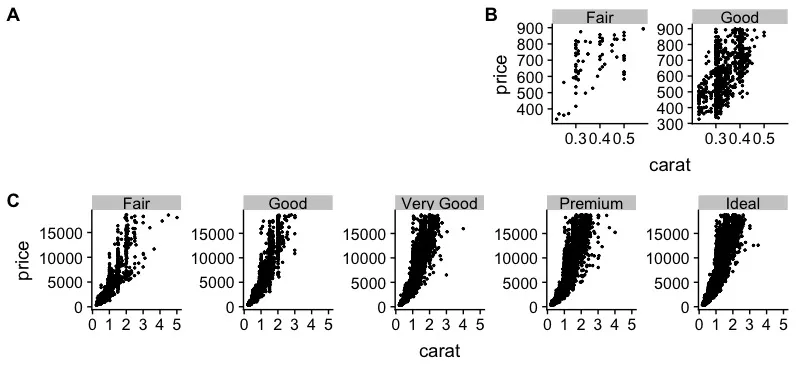
enter image description here

然而,我注意到面板B的y轴与面板C的最后两个图的y轴不完全对齐(尽管在两个面板中都使用了选项axis = 'lb')。 代码:
# Load libraries
library(tidyverse)
library(cowplot)

# Create two facetted plots 
p1 <- ggplot(data = diamonds, aes(x = carat, y = price)) +
  facet_wrap(~ cut, scales = "free_y", ncol = 5) +
  geom_point(size=0.5)

p2<- ggplot(data = filter(diamonds, price < 900 & (cut == "Fair" | cut == "Good" )), aes(x = carat, y = price)) +
  facet_wrap(~ cut, scales = "free_y", ncol = 2) +
  geom_point(size=0.5)

# Create panel A and panel B
a <- plot_grid(NULL, p2, labels = c("A", "B"), axis = 'lb', ncol = 2, rel_widths = c(3,2))

# Create a combined panel of 'a' and panel C
plot_grid(a, p1, labels = c("", "C"), axis = 'lb', ncol = 1, rel_heights = c(1,1))

起初,我以为这与y轴标签有关,但是去掉标签并没有解决问题。

问题

是什么导致了这种行为,如何使用cowplot包对使用facet_wrap生成的图形进行对齐。
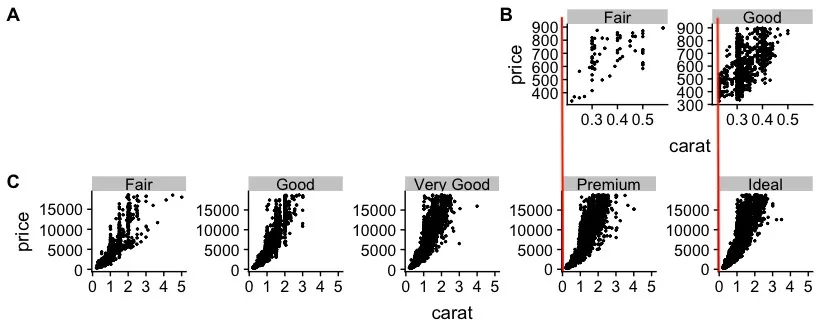
期望输出

我希望B面板的y轴垂直对齐于C面板中最后两个图形的y轴(即在红线处)。

enter image description here


对不起,这里的图片有点小,所以我之前有些困惑。我认为面板A不是问题,但也许有更有经验的人知道得更清楚。我认为问题在于 facet_wrap 在您的示例中的使用方式。因此,您创建了一个具有特定大小的绘图,一次有2个图,另一次有5个图。对我来说,您制作的图表中的图形的间距/大小只是由于这些 facet_wraps 不同而已。这不应该是无法解决的问题。 - Annet
1个回答

3

如我在评论中所说,我认为这与你的图像间距有关,这是由于2个和5个绘图之间的差异以及Y轴标签的差异导致的。我可能错了(这很可能),因此可能会有更简单/更漂亮的解决方案。再次强调,这只是一个提议,您可以尝试一下数字,但我认为这非常接近:

# Create two facetted plots 
p1 <- ggplot(data = diamonds, aes(x = carat, y = price)) +
  facet_wrap(~ cut, scales = "free_y", ncol = 5) +
  geom_point(size=0.5)

p2<- ggplot(data = filter(diamonds, price < 900 & (cut == "Fair" | cut == "Good" )), aes(x = carat, y = price)) +
  facet_wrap(~ cut, scales = "free_y", ncol = 2) +
  geom_point(size=0.5) +
  theme(panel.spacing = unit(1.15, "lines"),
        axis.title.y = element_text(margin = margin(t = 0, r = 5, b = 0, l = 0)))

# Create panel A and panel B
a <- plot_grid(NULL, p2, labels = c("A", "B"), axis = 'lb', ncol = 2, rel_widths = c(2.985,2.015))

# Create a combined panel of 'a' and panel C
plot_grid(a, p1, labels = c("", "C"), axis = 'lb', ncol = 1, rel_heights = c(1,1))

enter image description here

所以基本上我添加的是在你的p2图形之间增加了一些间距,因为底部图中的数字比顶部图中的数字占用更多的空间(毕竟有2个额外的数字)。对于我来说,这解决了右侧两个图的对齐问题。我还增加了标签到轴的边距。这解决了左上角图的对齐问题。我不确定改变标签和轴之间的距离是否可取。

这是一个非常好的解决方案!我不认为你错了,我觉得你抓住了问题的要点。 - tjebo

网页内容由stack overflow 提供, 点击上面的
可以查看英文原文,
原文链接