回答:用户和内核CPU时间是分别计量的,需要小心!
编辑:现在每次基准测试时pTimes都被重置为零,但结果变得更加怪异了!
为了研究自己的自定义内存管理方案,我在 Visual Community 2019(Windows 10)中创建了一个简单的基准测试,测试了现有malloc()函数。出于兴趣,我还测试了CPU时间和墙时间,并通过将一大块内存分配成多个块,然后单独释放每个块而不使用它们来测试malloc()。详情请见:
void malloc_distr256(int nMemsize) {
    long long pFreeList[256];

    for (int i = 0; i < 256; ++i) pFreeList[i] = malloc(nMemsize >> 8);
    for (int i = 0; i < 256; ++i) free((void*)pFreeList[i]);
}

void malloc_distr64(int nMemsize) {
    long long pFreeList[64];

    for (int i = 0; i < 64; ++i) pFreeList[i] = malloc(nMemsize >> 6);
    for (int i = 0; i < 64; ++i) free((void*)pFreeList[i]);
}

void malloc_distr0(int nMemsize) {
    void* pMem = malloc(nMemsize);

    free(pMem);
}
我使用以下代码测试了这些函数 - "BenchTimes"只是一个包含双倍CPU/墙时间的结构体:
inline double cputime() {
    FILETIME lpCreationTime;
    FILETIME lpExitTime;
    FILETIME lpKernelTime;
    FILETIME lpUserTime;

    if (GetProcessTimes(GetCurrentProcess(), &lpCreationTime, &lpExitTime, &lpKernelTime, &lpUserTime)) {
        double dUnits = (double)(lpUserTime.dwLowDateTime | (long long)lpUserTime.dwHighDateTime << 32);
        return dUnits * 0.1;
    }
    else return 0xFFF0000000000000;
}

inline double walltime() {
    LARGE_INTEGER lnFreq, lnTime;

    if (QueryPerformanceFrequency(&lnFreq)) if (QueryPerformanceCounter(&lnTime))
        return 1000000.0 * (double)lnTime.QuadPart / (double)lnFreq.QuadPart;
//multiply by 1,000,000 to convert seconds to microseconds
//because the cpu time measurer I had in microseconds as well
    return 0.0;
}

void bench(void (pfnFunc)(int), int nMemsize, int nIters, int nReps, BenchTimes* pTimes) {
    pTimes->dCpuTime = 0.0;
    pTimes->dWallTime = 0.0;

    for (volatile int r = 0; r < nReps; ++r) {
        double dCpuStart = cputime();
        double dWallStart = walltime();

        for (volatile int i = 0; i < nIters; ++i) pfnFunc(nMemsize);

        double dCpuEnd = cputime();
        double dWallEnd = walltime();

        double dCpuDiff = dCpuEnd - dCpuStart;
        double dWallDiff = dWallEnd - dWallStart;

        pTimes->dCpuTime += dCpuDiff;
        pTimes->dWallTime += dWallDiff;
    }
}
这些是我电脑(i5-9400f)测量的时间,以秒为单位。
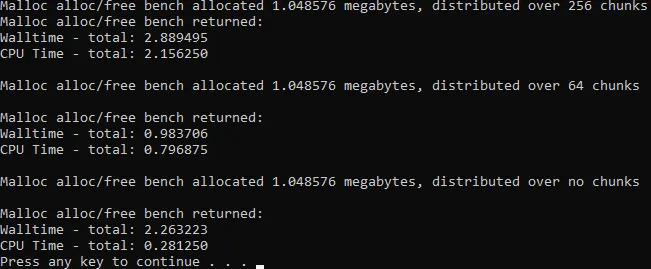 我对性能和墙时与CPU时间的巨大差异非常好奇!
运行此代码的代码如下:
    BenchTimes sTimes;

    bench(malloc_distr256, 1 << 20, 100, 1000, &sTimes);

    fprintf(stdout, "Malloc alloc/free bench allocated %lf megabytes, distributed over 256 chunks\n", (double)(1 << 20) / 1000000);
    fprintf(stdout, "Malloc alloc/free bench returned:\nWalltime - total: %lf\nCPU Time - total: %lf\n", sTimes.dWallTime / 1000000, sTimes.dCpuTime / 1000000);

    bench(malloc_distr64, 1 << 20, 100, 1000, &sTimes);

    fprintf(stdout, "\nMalloc alloc/free bench allocated %lf megabytes, distributed over 64 chunks\n", (double)(1 << 20) / 1000000);
    fprintf(stdout, "\nMalloc alloc/free bench returned:\nWalltime - total: %lf\nCPU Time - total: %lf\n", sTimes.dWallTime / 1000000, sTimes.dCpuTime / 1000000);

    bench(malloc_distr0, 1 << 20, 100, 1000, &sTimes);

    fprintf(stdout, "\nMalloc alloc/free bench allocated %lf megabytes, distributed over no chunks\n", (double)(1 << 20) / 1000000);
    fprintf(stdout, "\nMalloc alloc/free bench returned:\nWalltime - total: %lf\nCPU Time - total: %lf\n", sTimes.dWallTime / 1000000, sTimes.dCpuTime / 1000000);

    system("pause");
long long pFreeList[256];?而不是void *pFreeList[256];? - Some programmer dudebench?),我们只能猜测,但我的猜测是您在调用之间没有重置pTimes的成员。 - Some programmer dude