我尝试计算不同数组中
为了生成
这段代码生成:
如果我绘制 (x1,y1), (x2,y2), (x3,y3), (x4,y4),则 y 值在 x 值为 0 到 16 之间分布如下。一些 x 值只有一个 y 值,而其他 x 值可能在图中具有多个 y 值。我想在每个 x 值处取一个 y 值的平均值。
y的平均值,例如np.mean(,axis=1),但使用了不同的x值。为了生成
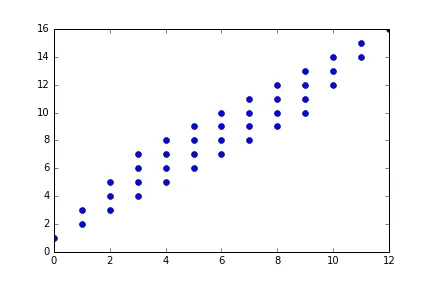
x和y数组,我使用了以下代码:x1=np.arange(10)
x2 = np.arange(10)+1
x3 = np.arange(10)+2
x4 = np.arange(10)+3
y1 = x1+1
y2 = x2+2
y3 = x3+3
y4 = x4 +4
这段代码生成:
x1 = [0 1 2 3 4 5 6 7 8 9]
x2 = [ 1  2  3  4  5  6  7  8  9 10]
x3 = [ 2  3  4  5  6  7  8  9 10 11]
x4 = [ 3  4  5  6  7  8  9 10 11 12]
y1 = [ 1  2  3  4  5  6  7  8  9 10]
y2 = [ 3  4  5  6  7  8  9 10 11 12]
y3 = [ 5  6  7  8  9 10 11 12 13 14]
y4 = [ 7  8  9 10 11 12 13 14 15 16]
如果我绘制 (x1,y1), (x2,y2), (x3,y3), (x4,y4),则 y 值在 x 值为 0 到 16 之间分布如下。一些 x 值只有一个 y 值,而其他 x 值可能在图中具有多个 y 值。我想在每个 x 值处取一个 y 值的平均值。