forcatsvignette指出:
forcats包的目标是提供一组有用的工具,以解决因子数据类型常见问题
事实上,其中一个工具是通过另一个变量重新排序因子,这在绘制数据时非常常见。我试图使用forcats来完成这个任务,但是只在一个分面上。也就是说,我想通过另一个变量重新排序因子,但只使用数据的子集。以下是一个reprex:
library(tidyverse)

ggplot2::diamonds %>%
    group_by(cut, clarity) %>%
    summarise(value = mean(table, na.rm = TRUE)) %>%
    ggplot(aes(x = clarity, y = value, color = clarity)) +
    geom_segment(aes(xend = clarity, y = min(value), yend = value),
                 size = 1.5, alpha = 0.5) +
    geom_point(size = 3) +
    facet_grid(rows = "cut", scales = "free") +
    coord_flip() +
    theme(legend.position = "none")
这段代码产生了接近我想要的图形:
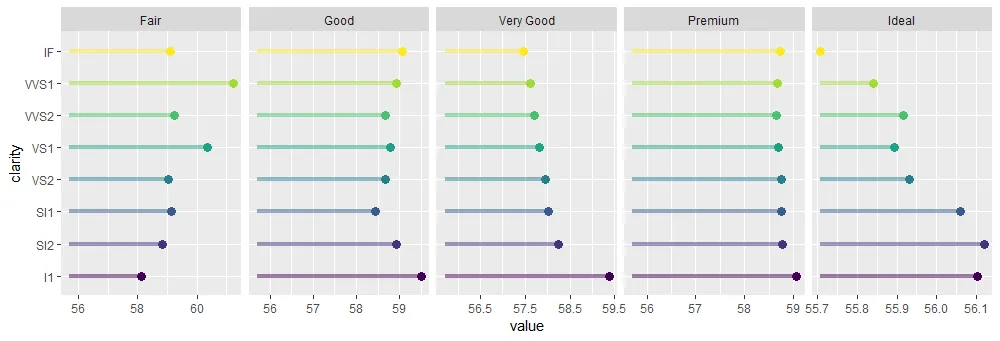
当然,直接使用
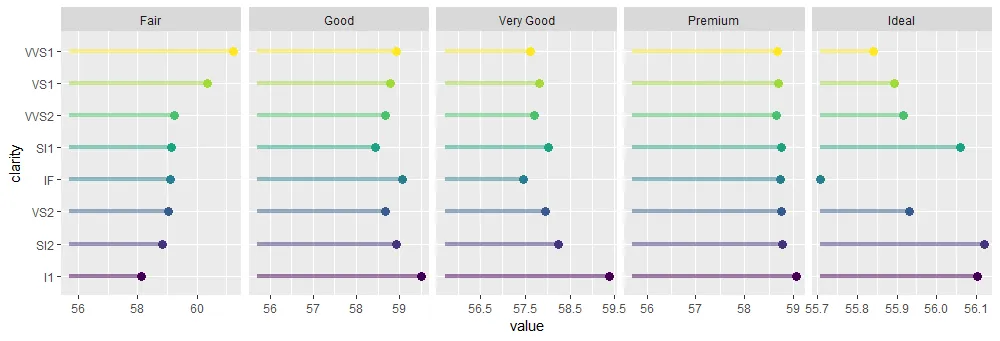
forcats在这种情况下无法工作,因为它会基于所有值而不仅仅是特定小图内的值来重新排序因子。让我们这样做:# Inserting this line right before the ggplot call
mutate(clarity = forcats::fct_reorder(clarity, value)) %>%
它随后生成了这个图表。
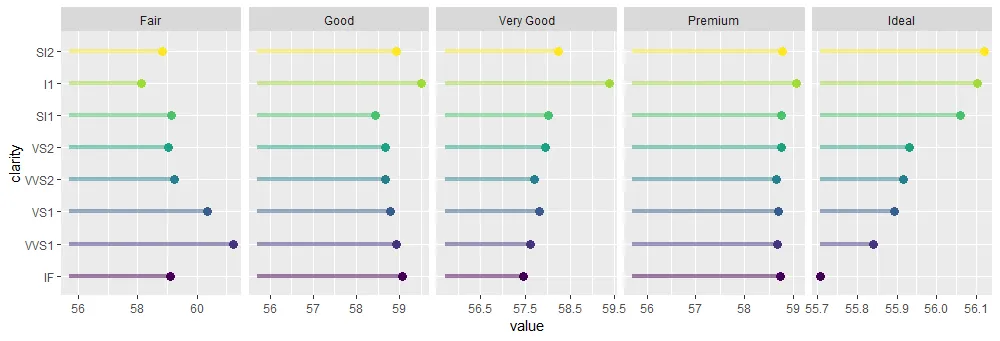
 当然,它根据整个数据重新排列了因子,但如果我想按“理想”切割的值排序绘图呢?我该如何用
forcats实现?我的当前解决方案如下:
ggdf <- ggplot2::diamonds %>%
    group_by(cut, clarity) %>%
    summarise(value = mean(table, na.rm = TRUE))

# The trick would be to create an auxiliary factor using only
# the subset of the data I want, and then use the levels
# to reorder the factor in the entire dataset.
#
# Note that I use good-old reorder, and not the forcats version
# which I could have, but better this way to emphasize that
# so far I haven't found the advantage of using forcats
reordered_factor <- reorder(ggdf$clarity[ggdf$cut == "Ideal"],
                            ggdf$value[ggdf$cut == "Ideal"])

ggdf$clarity <- factor(ggdf$clarity, levels = levels(reordered_factor))

ggdf %>%
    ggplot(aes(x = clarity, y = value, color = clarity)) +
    geom_segment(aes(xend = clarity, y = min(value), yend = value),
                 size = 1.5, alpha = 0.5) +
    geom_point(size = 3) +
    facet_grid(rows = "cut", scales = "free") +
    coord_flip() +
    theme(legend.position = "none")
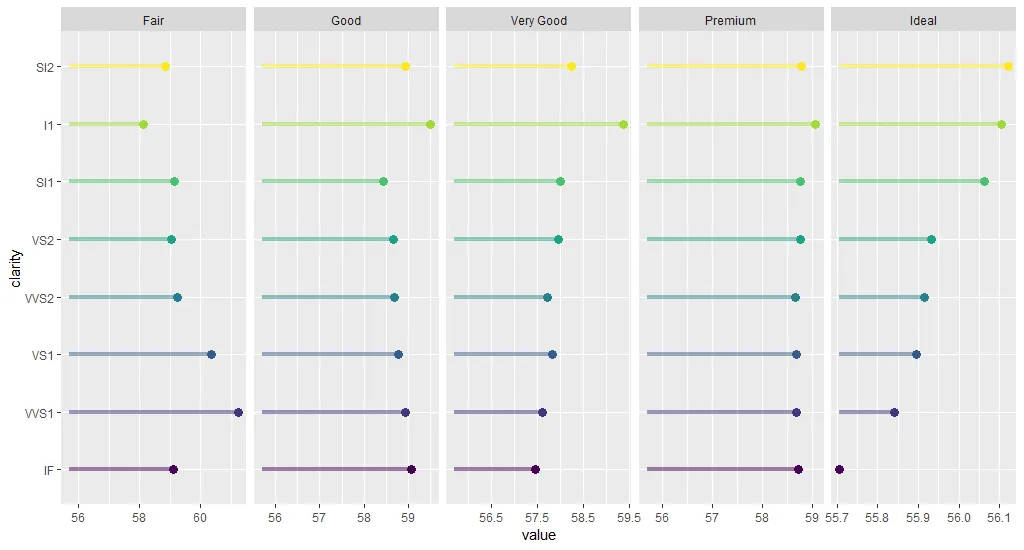
它会生成我想要的内容。
但我想知道是否有更优雅/聪明的方法使用forcats来做到这一点。
group_by函数中的第一个变量。 - mrjoh3