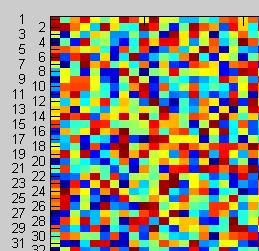
imagesc(X);
所有行都使用标签进行标注:
set(gca, 'YTickLabel', somelabels);
尽管数据X已经被正确地绘制出来,并且Y轴刻度标签也被显示出来了,但由于行数过多,标签高度重叠。有没有什么方法可以解决这个问题?非常感谢您的帮助。
编辑1:
我意识到我的问题表述不太清楚,无法准确反映我的问题。根据答案,我将总结自己的理解并重新提问:
To show as many rows/labels in a Figure Window, the following helps:
set(gca,'FontSize',6),
or, alternate the distance (suggested by yuk),
or, set(gca,'YTick',1:10:1000,'YTickLabel',somelabels(1:10:1000));
The code
set(gca,'Units','pixels','Position',[20 20 10000 10000]);will display a zoomed-in image by default. But if the zoomed-in image is too large to fit in the Figure Window, only part of the image will be displayed. However, neither zoom out nor the pan tool can reach to the rest part of that image.
The default behavior of the code
imagesc(X);
set(gca, 'ytick', 1:1000, 'yticklabe', ylabel);
displays the whole image fitting to the Figure Window with overlapping labels. Nevertheless, it does allow one to zoom into part of the image and to see the un-overlapped labels.
If I save the image into a pdf file:
imagesc(X);
set(gca, 'ytick', 1:1000, 'yticklabe', ylabel);
saveas(gcf, 'fig.pdf');
Then the saved pdf is only the image fit to the Figure Window with overlapping labels. However, unlike zoom in within Matlab figure window, zoom in within a pdf reader won't change the relative position/distance of labels. As a result, the zoomed-in image in pdf is still label-overlaped.
我的问题是:
如何将图像保存为PDF文件或PNG文件,使其在Adobe Reader中打开时具有与上面第3点类似的行为,而不是第4点的行为?