我正在尝试使用
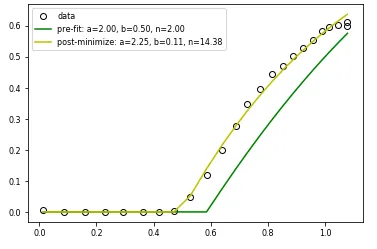
我还使用了 SCIPY MINIMIZE 来实现同样的功能。如下图所示,MINIMIZE 能够正常工作,但 CURVE_FIT 基本上用完了所有的评估次数并放弃了,尽管起始猜测与 MINIMIZE 解决方案(至少从视觉上)并不相差太远。希望能得到任何关于为什么 curve_fit 在这里似乎无法工作的想法。
scipy curve_fit将函数y= 1-a(1-bx)**n拟合到一些实验数据中。该模型仅适用于y>0,因此我剪切计算出的值以强制执行此条件。下面是代码:import numpy as np
import scipy.optimize
import matplotlib.pyplot as plt
# Driver function for scipy.minimize
def driver_func(x, xobs, yobs):
# Evaluate the fit function with the current parameter estimates
ynew = myfunc(xobs, *x)
yerr = np.sum((ynew - yobs) ** 2)
return yerr
# Define function
def myfunc(x, a, b, n):
y = 1.0 - a * np.power(1.0 - b * x, n)
y = np.clip(y, 0.00, None )
return y
if __name__ == "__main__":
# Initialise data
yobs = np.array([0.005, 0.000, 0.000, 0.000, 0.000, 0.000, 0.000, 0.004,
0.048, 0.119, 0.199, 0.277, 0.346, 0.395, 0.444, 0.469,
0.502, 0.527, 0.553, 0.582, 0.595, 0.603, 0.612, 0.599])
xobs = np.array([0.013, 0.088, 0.159, 0.230, 0.292, 0.362, 0.419, 0.471,
0.528, 0.585, 0.639, 0.687, 0.726, 0.772, 0.814, 0.854,
0.889, 0.924, 0.958, 0.989, 1.015, 1.045, 1.076, 1.078])
# Initial guess
p0 = [2.0, 0.5, 2.0]
# Check fit pre-regression
yold = myfunc(xobs, *p0)
plt.plot(xobs, yobs, 'ko', label='data', fillstyle='none')
plt.plot(xobs, yold, 'g-', label='pre-fit: a=%4.2f, b=%4.2f, n=%4.2f' % tuple(p0))
# Fit curve using SCIPY CURVE_FIT
try:
popt, pcov = scipy.optimize.curve_fit(myfunc, xobs, yobs, p0=p0)
except:
print("Could not fit data using SCIPY curve_fit")
else:
ynew = myfunc(xobs, *popt)
plt.plot(xobs, ynew, 'r-', label='post-curve_fit: a=%4.2f, b=%4.2f, n=%4.2f' % tuple(popt))
# Fit curve using SCIPY MINIMIZE
res = scipy.optimize.minimize(driver_func, p0, args=(xobs, yobs), method='Nelder-Mead')
ynw2 = myfunc(xobs, *res.x)
plt.plot(xobs, ynw2, 'y-', label='post-minimize: a=%4.2f, b=%4.2f, n=%4.2f' % tuple(res.x))
plt.legend()
plt.show()
我还使用了 SCIPY MINIMIZE 来实现同样的功能。如下图所示,MINIMIZE 能够正常工作,但 CURVE_FIT 基本上用完了所有的评估次数并放弃了,尽管起始猜测与 MINIMIZE 解决方案(至少从视觉上)并不相差太远。希望能得到任何关于为什么 curve_fit 在这里似乎无法工作的想法。
谢谢!
def myfunc_noclip(x, a, b, n):
    y = 1.0 - a * np.power(1.0 - b * x, n)
    return y
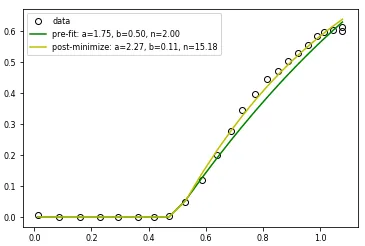
introduced clipped arrays by removing data below a threshold
ymin = 0.01
xclp = xobs[np.where(yobs >= ymin)]
yclp = yobs[np.where(yobs >= ymin)]
improved the initial guess (again visually)
p0 = [1.75, 0.5, 2.0]updated the call to curve_fit
popt, pcov = scipy.optimize.curve_fit(myfunc_noclip, xclp, yclp, p0=p0)
scipy curve_fit在拟合参数中有指数时存在困难,例如
SciPy curve_fit not working when one of the parameters to fit is a power
所以我猜我也遇到了同样的问题。不确定如何解决...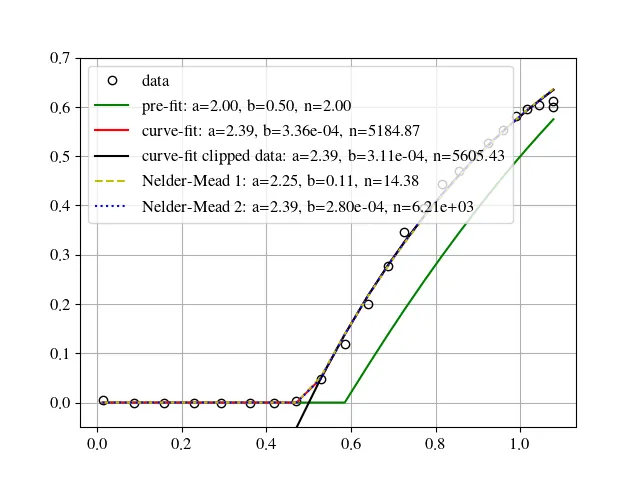
b * n相关,所以你可以轻松地在它们之间进行转换。根据问题背后的物理学,你可以尝试不同的饱和模型。 - mikuszefski