我需要制作一个偏移平行的翼型剖面曲线,但是我不知道如何使所有点与原始主要剖面曲线上的点在所需距离上等距分布。
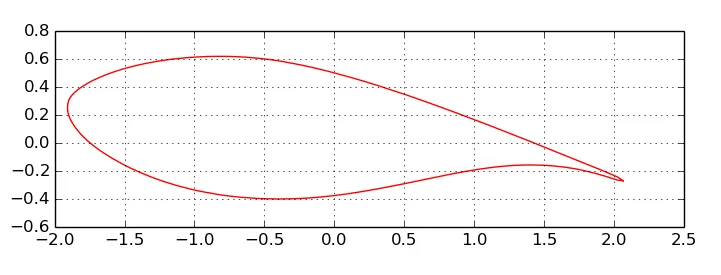
这是我的翼型剖面示例
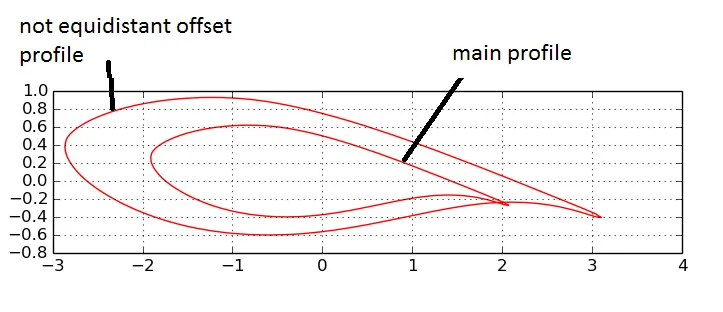
 这是我最好的但并不理想的方法
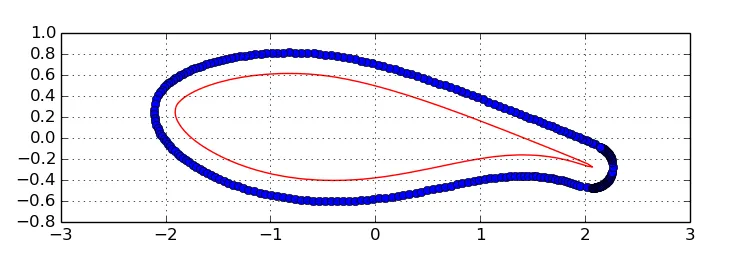
 编辑 @Patrick 解决方案,距离为0.2
这是我最好的但并不理想的方法
编辑 @Patrick 解决方案,距离为0.2
这是我最好的但并不理想的方法
编辑 @Patrick 解决方案,距离为0.2
def offset(coordinates, distance):
    coordinates = iter(coordinates)
    x1, y1 = coordinates.next()
    z = distance
    points = []
    for x2, y2 in coordinates:
        # tangential slope approximation
        try:
            slope = (y2 - y1) / (x2 - x1)
            # perpendicular slope
            pslope = -1/slope  # (might be 1/slope depending on direction of travel)
        except ZeroDivisionError:
            continue
        mid_x = (x1 + x2) / 2
        mid_y = (y1 + y2) / 2

        sign = ((pslope > 0) == (x1 > x2)) * 2 - 1

        # if z is the distance to your parallel curve,
        # then your delta-x and delta-y calculations are:
        #   z**2 = x**2 + y**2
        #   y = pslope * x
        #   z**2 = x**2 + (pslope * x)**2
        #   z**2 = x**2 + pslope**2 * x**2
        #   z**2 = (1 + pslope**2) * x**2
        #   z**2 / (1 + pslope**2) = x**2
        #   z / (1 + pslope**2)**0.5 = x

        delta_x = sign * z / ((1 + pslope**2)**0.5)
        delta_y = pslope * delta_x

        points.append((mid_x + delta_x, mid_y + delta_y))
        x1, y1 = x2, y2
    return points

def add_semicircle(x_origin, y_origin, radius, num_x = 50):
    points = []
    for index in range(num_x):
        x = radius * index / num_x
        y = (radius ** 2 - x ** 2) ** 0.5
        points.append((x, -y))
    points += [(x, -y) for x, y in reversed(points)]
    return [(x + x_origin, y + y_origin) for x, y in points]

def round_data(data):
    # Add infinitesimal rounding of the envelope
    assert data[-1] == data[0]
    x0, y0 = data[0]
    x1, y1 = data[1]
    xe, ye = data[-2]

    x = x0 - (x0 - x1) * .01
    y = y0 - (y0 - y1) * .01
    yn = (x - xe) / (x0 - xe) * (y0 - ye) + ye
    data[0] = x, y
    data[-1] = x, yn
    data.extend(add_semicircle(x, (y + yn) / 2, abs((y - yn) / 2)))
    del data[-18:]

from pylab import *

with open('ah79100c.dat', 'rb') as f:
    f.next()
    data = [[float(x) for x in line.split()] for line in f if line.strip()]

t = [x[0] for x in data]
s = [x[1] for x in data]


round_data(data)

parallel = offset(data, 0.1)
t2 = [x[0] for x in parallel]
s2 = [x[1] for x in parallel]

plot(t, s, 'g', t2, s2, 'b', lw=1)

title('Wing with envelope')
grid(True)

axes().set_aspect('equal', 'datalim')

savefig("test.png")
show()
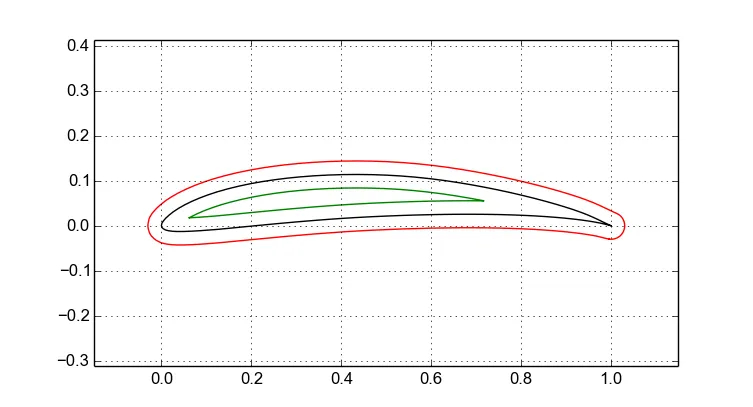
x2, x1 和 y2, y1 是翼型轮廓中的两个相邻点?因此我必须从 x[0] 迭代到 x[len(x)-1]? - efirvida(x1 + x2) / 2, (y1 + y2) / 2。 - Patrick Maupin如果你愿意(并且能够)安装第三方工具,我强烈推荐使用Shapely模块。以下是一个小示例,可以同时向内和向外偏移:
from StringIO import StringIO
import matplotlib.pyplot as plt
import numpy as np
import requests
import shapely.geometry as shp

# Read the points
AFURL = 'http://m-selig.ae.illinois.edu/ads/coord_seligFmt/ah79100c.dat'
afpts = np.loadtxt(StringIO(requests.get(AFURL).content), skiprows=1)

# Create a Polygon from the nx2 array in `afpts`
afpoly = shp.Polygon(afpts)

# Create offset airfoils, both inward and outward
poffafpoly = afpoly.buffer(0.03)  # Outward offset
noffafpoly = afpoly.buffer(-0.03)  # Inward offset

# Turn polygon points into numpy arrays for plotting
afpolypts = np.array(afpoly.exterior)
poffafpolypts = np.array(poffafpoly.exterior)
noffafpolypts = np.array(noffafpoly.exterior)

# Plot points
plt.plot(*afpolypts.T, color='black')
plt.plot(*poffafpolypts.T, color='red')
plt.plot(*noffafpolypts.T, color='green')
plt.axis('equal')
plt.show()
以下是输出结果;请注意内部偏移的“蝴蝶结”(自交)已经被自动删除: