我试图做一些看起来很简单的事情,但似乎无法使其正常工作。
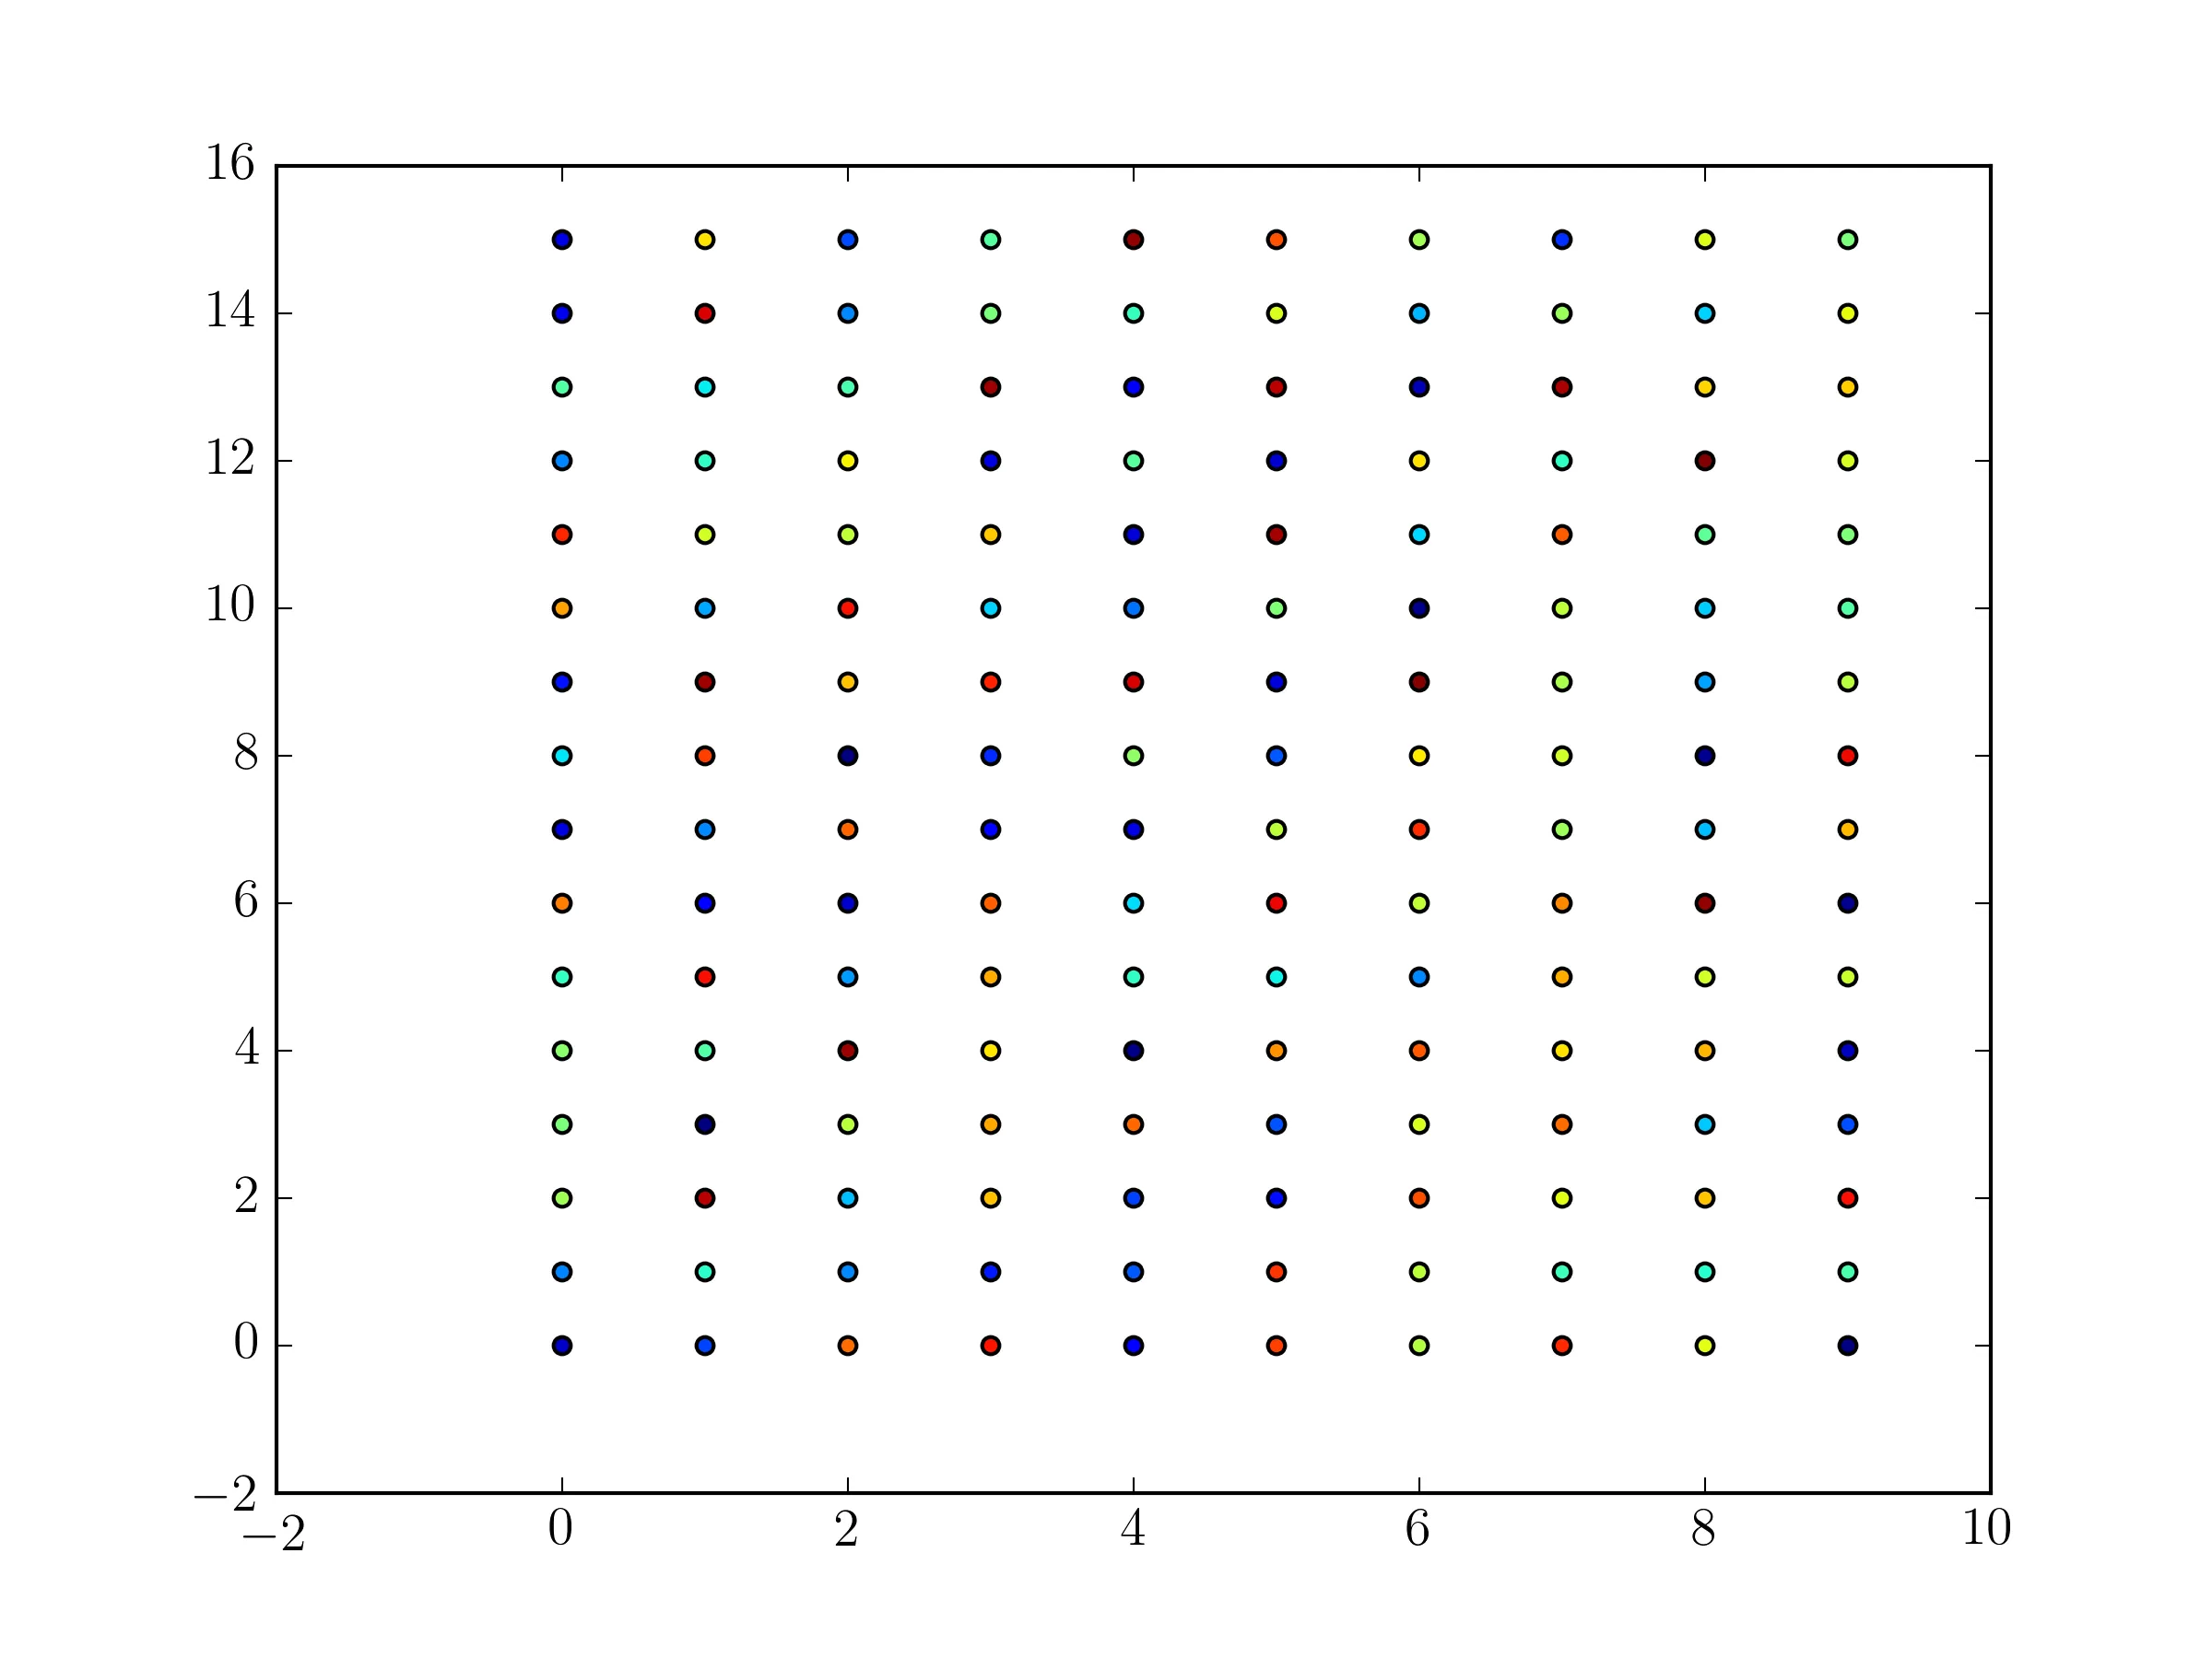
我想绘制16个字节值随时间变化的曲线。我尝试使用散点图: x轴为测量指数 y轴为字节索引 颜色表示字节的值。
我已经将数据存储在一个numpy数组中,其中data [2] [14]会给我第二次测量中第14个字节的值。
每次我尝试绘制它,要么出现:
ValueError: x and y must be the same size
IndexError: index 10 is out of bounds for axis 0 with size 10
这是我正在使用的样本测试:
import numpy
import numpy.random as nprnd
import matplotlib.pyplot as plt

#generate random measurements
# 10 measurements of 16 byte values
x = numpy.arange(10)
y = numpy.arange(16)
test_data = nprnd.randint(low=0,high=65535, size=(10, 16))

#scatter plot the measurements with
# x - measurement index (0-9 in this case)
# y - byte value index (0-15 in this case)
# c = test_data[x,y]

plt.scatter(x,y,c=test_data[x][y])
plt.show()
我确定是我做错了一些愚蠢的事情,但似乎无法弄清楚是什么。
感谢您的帮助。