我一直在考虑使用par()或layout()函数来组合ggplot。能否使用这些函数呢?
假设我想为散点图绘制ggplot,并为直方图绘制ggplot。并且我想将这两个绘图组合起来(不是在一个图中)。这可行吗?
我在R中尝试了简单的绘图,而没有使用ggplot函数。实际上它可以工作。
这里有一个来自Quick-R的示例,链接:http://www.statmethods.net/advgraphs/layout.html
# 4 figures arranged in 2 rows and 2 columns
attach(mtcars)
par(mfrow=c(2,2))
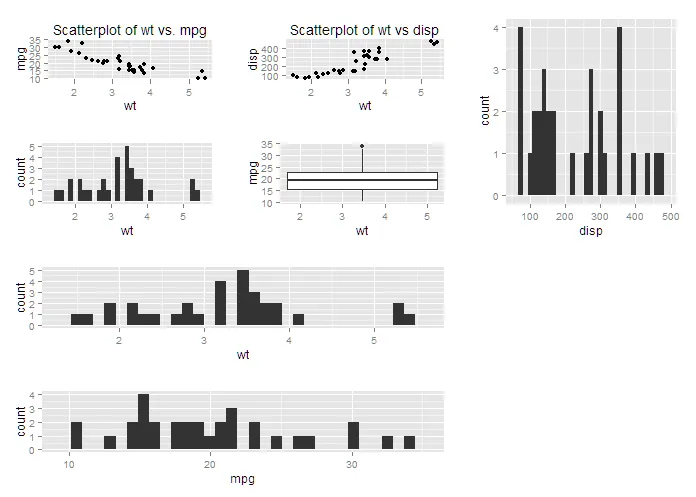
plot(wt,mpg, main="Scatterplot of wt vs. mpg")
plot(wt,disp, main="Scatterplot of wt vs disp")
hist(wt, main="Histogram of wt")
boxplot(wt, main="Boxplot of wt")
# One figure in row 1 and two figures in row 2
attach(mtcars)
layout(matrix(c(1,1,2,3), 2, 2, byrow = TRUE))
hist(wt)
hist(mpg)
hist(disp)
但是,当我尝试使用ggplot并结合绘图时,我没有得到输出结果。
layout()的东西,那么您可能需要像kohske提到的那样使用grid.arrange()。这篇链接的帖子(特别是Ben Bolker的回答)将为您提供一个很好的起点。 - Josh O'Brien