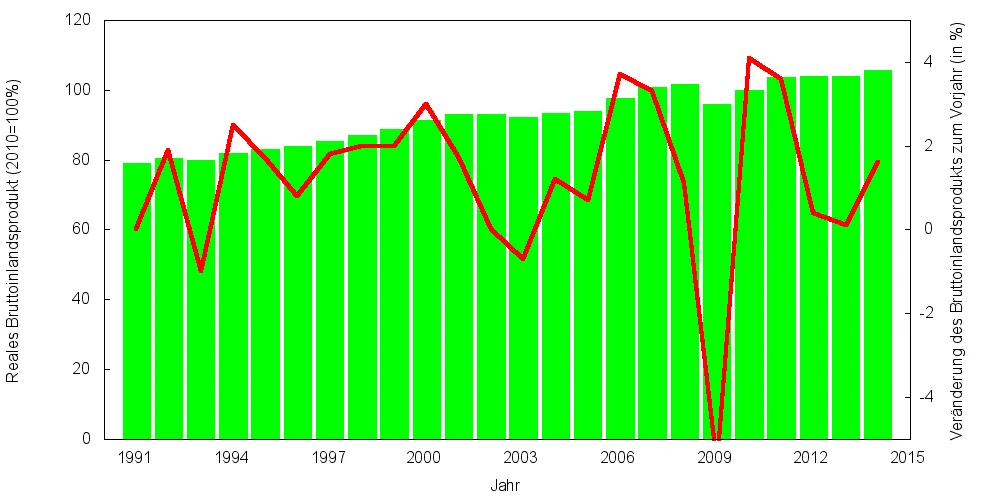
数据文件bipdeutschland.csv:
1991    79.09   0
1992    80.61   1.9
1993    79.84   –1.0
1994    81.8    2.5
1995    83.19   1.7
1996    83.84   0.8
1997    85.37   1.8
1998    87.05   2
1999    88.78   2
2000    91.43   3
2001    92.98   1.7
2002    92.99   0
2003    92.32   –0.7
2004    93.41   1.2
2005    94.07   0.7
2006    97.56   3.7
2007    100.75  3.3
2008    101.81  1.1
2009    96.07   –5.6
2010    100.00  4.1
2011    103.59  3.6
2012    103.98  0.4
2013    104.09  0.1
2014    105.76  1.6
PLT文件:
set xdata time
set timefmt "%Y"
set format x "%Y"
set format y "%6.0f"
set xrange ["1990":"2015"]
set yrange [0:120]
set style fill solid 1.0
set boxwidth 0.85 relative

set xlabel "Jahr"
set ylabel "Reales Bruttoinlandsprodukt (2010=100%)"

set y2range [-5:5]
set y2label "Veränderung des Bruttoinlandsprodukts zum Vorjahr (in %)"
set y2tics 2
set ytics nomirror
set xtics nomirror

set output "bipdeutschland.png"
set term png size 1000, 500
plot "bipdeutschland.csv" using 1:2 title '' w boxes lc rgb "green", "bipdeutschland.csv" using 1:3 title '' with lines lw 4 lc rgb "red" axes x1y2;
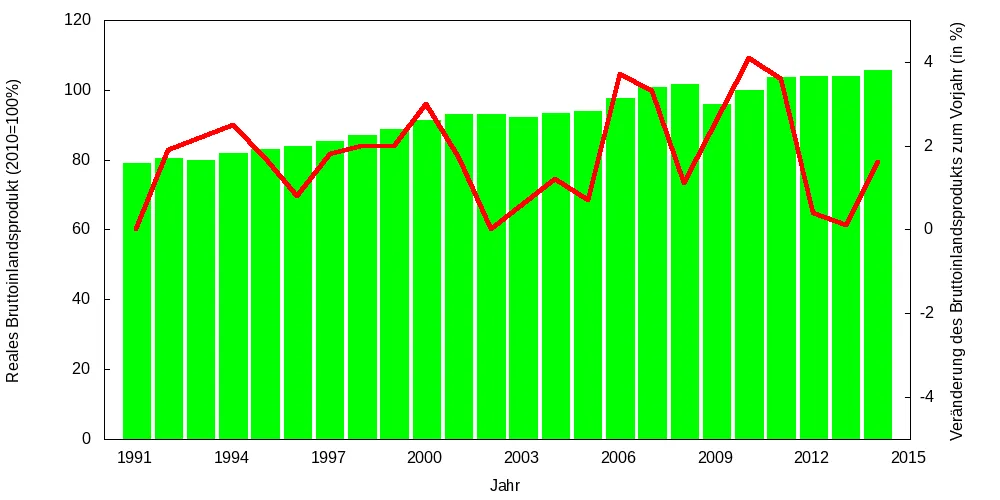
对于1993年、2003年和2009年,红色线应该在负区间,但显然不是。问题出在哪里?是gnuplot无法解析输入文件还是我的代码有误?