如果您不想要箭头,那么可以尝试脉冲样式(使用脉冲而不是线条)(如果您仍然想要顶部的线条,则可以绘制两次)。
如果您真的想要箭头,则以下内容可能会有所帮助:它使用for循环(或排序)向绘图添加垂直箭头。
Gnuplot脚本,在现有绘图中添加for循环
具体来说:
创建一个名为simloop.gp的文件,其内容如下:
count = count+1
system 'echo '.count.' > count.gp'
system "./simloop.sh"
load 'draw_arrow.gp'
if(count<max) reread
然后创建一个类似于以下内容的 simloop.sh 文件
#!/bin/bash
count=$(awk -F, '{print $1}' count.gp)
xcoord=$(awk -v count=$count -F, 'BEGIN{FS=" ";}{ if(NR==count) print $1}' simulation.dat)
ycoord=$(awk -v count=$count -F, 'BEGIN{FS=" "}{ if(NR==count) print $2}' simulation.dat)
dir=$(awk -v count=$count -F, 'BEGIN{FS=" "}{ if(NR==count) print $3}' simulation.dat)
if [ \"$dir\" == \"0\" ]; then
echo '' > draw_arrow.gp
fi
if [ \"$dir\" == \"1\" ]; then
echo 'set arrow from ' $xcoord' ,0 to '$xcoord','$ycoord' head' > draw_arrow.gp
fi
if [ \"$dir\" == \"2\" ]; then
echo 'set arrow from '$xcoord',0 to '$xcoord','$ycoord' backhead' > draw_arrow.gp
fi
然后创建一个类似如下的simulation.gp文件:
count = 0
max = 5
load "simloop.gp"
set yrange[0:*]
plot "simulation.dat" u 1:2 w l
请确保shell文件具有可执行权限(chmod +wrx simloop.sh),加载gnuplot并输入以下命令:
load "./simulation.gp"
这对我来说很有效,使用了数据文件
1  99   0
2  92.7 1
3 100.3 2
4 44.2  0
5 71.23 1
(为了测试,我去掉了时间格式。您应该可以很容易地将其放回去。)
然后我得到了这张图表:
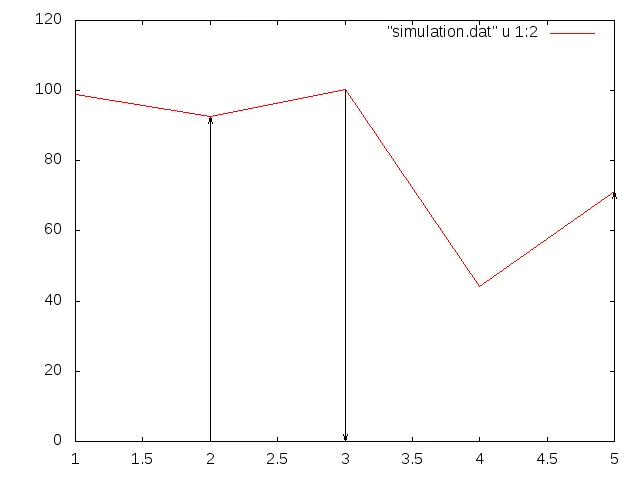
我认为这差不多是您想要的。