除了@Friedrich的解决方案,我想建议一个更一般的解决方案(尽管更复杂)。
我假设你想绘制箭头以外的东西。
如果您的图形需要使用调色板,我猜您会遇到麻烦,因为我不确定gnuplot是否支持在一个plot命令中使用多个调色板
(参见
Gnuplot 5.2 splot: Multiple pm3d palette in one plot call)。因此,您必须自己实现箭头的调色板(例如,请参见
Gnuplot: transparency of data points when using palette)。如果您想使用Cubic Bézier绘制弯曲箭头,请参考(
https://stackoverflow.com/a/60389081/7295599)。
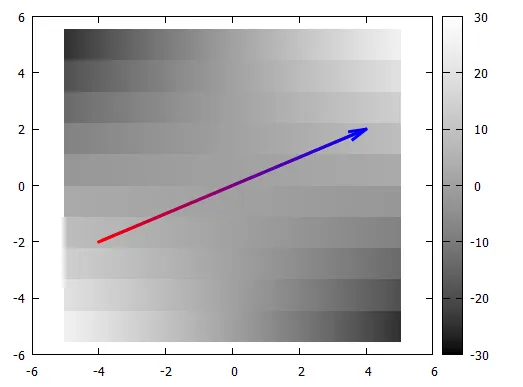
代码:
reset session
array A[4] = [-4,-2,4,2]
Ax(t) = A[1] + t*(A[3]-A[1])
Ay(t) = A[2] + t*(A[4]-A[2])
AColorStart = 0xff0000
AColorEnd = 0x0000ff
r(c) = (c & 0xff0000)>>16
g(c) = (c & 0x00ff00)>>8
b(c) = (c & 0x0000ff)
AColor(t) = ((int(r(AColorStart)*(1-t)+r(AColorEnd)*t))<<16) + \
((int(g(AColorStart)*(1-t)+g(AColorEnd)*t))<<8) + \
int(b(AColorStart)*(1-t)+b(AColorEnd)*t)
array AHead[1]
set angle degrees
set style arrow 1 lw 3 lc rgb var size 0.5,15 fixed
set palette grey
plot '++' u 1:2:($1*$2) w image notitle, \
[0:0.99] '+' u (Ax($1)):(Ay($1)):(AColor($1)) w l lw 3 lc rgb var notitle,\
AHead u (Ax(0.99)):(Ay(0.99)):(Ax(1)-Ax(0.99)):(Ay(1)-Ay(0.99)):(AColor($1)) w vec as 1 notitle
Result:
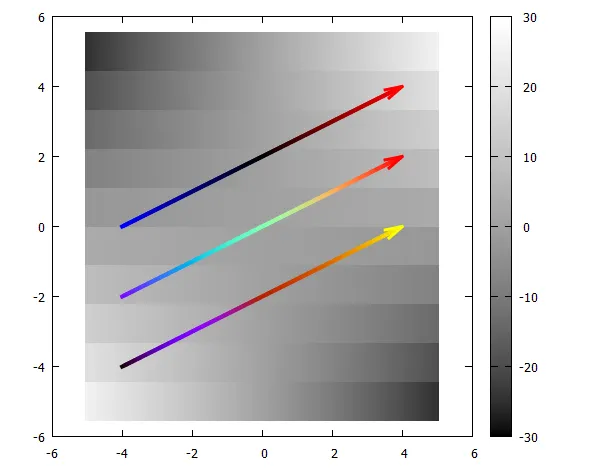
补充:
以下是一种变化形式,允许绘制多个箭头,每个箭头带有不同的调色板。我猜这需要 gnuplot 5.2,因为它需要索引数据块 $PALETTE[i]。
代码:
reset session
set print $myPalettes
test palette
print $PALETTE
set palette rgb 33,13,10
test palette
print $PALETTE
set palette defined (0 "blue", 1 "black", 2 "red")
test palette
print $PALETTE
set print
ColorComp(p,t,c) = int(word($myPalettes[p*257+int(255*t)+1],c+1)*0xff)
AColor(p,t) = (ColorComp(p,t,1)<<16) + (ColorComp(p,t,2)<<8) + ColorComp(p,t,3)
set size ratio -1
set angle degrees
unset key
set style arrow 1 lw 3 lc rgb var size 0.5,15 fixed
array AHead[1]
set palette grey
$Arrows <<EOD
-4 -4 4 0 0
-4 -2 4 2 1
-4 0 4 4 2
EOD
Ax(i,t) = word($Arrows[i],1) + t*(word($Arrows[i],3)-word($Arrows[i],1))
Ay(i,t) = word($Arrows[i],2) + t*(word($Arrows[i],4)-word($Arrows[i],2))
Palette(i) = int(word($Arrows[i],5))
plot '++' u 1:2:($1*$2) w image, \
for [i=1:|$Arrows|] [0:0.99:0.01] '+' u (Ax(i,$1)):(Ay(i,$1)):(AColor(Palette(i),$1)) w l lw 4 lc rgb var, \
for [i=1:|$Arrows|] AHead u (Ax(i,0.99)):(Ay(i,0.99)): \
(Ax(i,1)-Ax(i,0.99)):(Ay(i,1)-Ay(i,0.99)):(AColor(Palette(i),$1)) w vec as 1
Result: