我需要在我的图表中创建多个垂直渐变 - 共四个,以便澄清方向(北,东,南,西)。
#set 0 to 45 degrees color
set obj 1 rectangle behind from screen 0.09,0.2 to screen 0.89,0.29
set palette model RGB defined ( 0 "white", 1 "red")
set cbrange[0:1]
unset colorbox
我这里是否有什么遗漏?谢谢提前。
你无法使用渐变填充矩形。调色板只影响绘制的函数或数据集。你可以使用image或pm3d绘图样式来完成这个任务。
例如:
set samples 100
set isosample 100,100
set xrange [0:1]
set yrange [0:1]
set palette defined (0 "white", 1 "red")
set autoscale cbfix
unset colorbox
unset key

set multiplot layout 2,2
plot '++' using 1:2:1 with image
plot '++' using 1:2:2 with image
plot '++' using 1:2:(-$1) with image
plot '++' using 1:2:(-$2) with image
unset multiplot
使用pngcairo终端和版本4.6.5的输出如下:
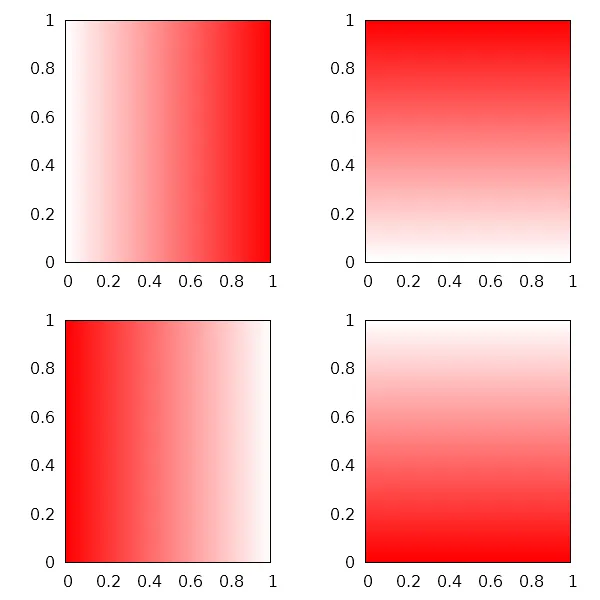
现在您需要找到一种方法将其与您拥有的其他图形集成。