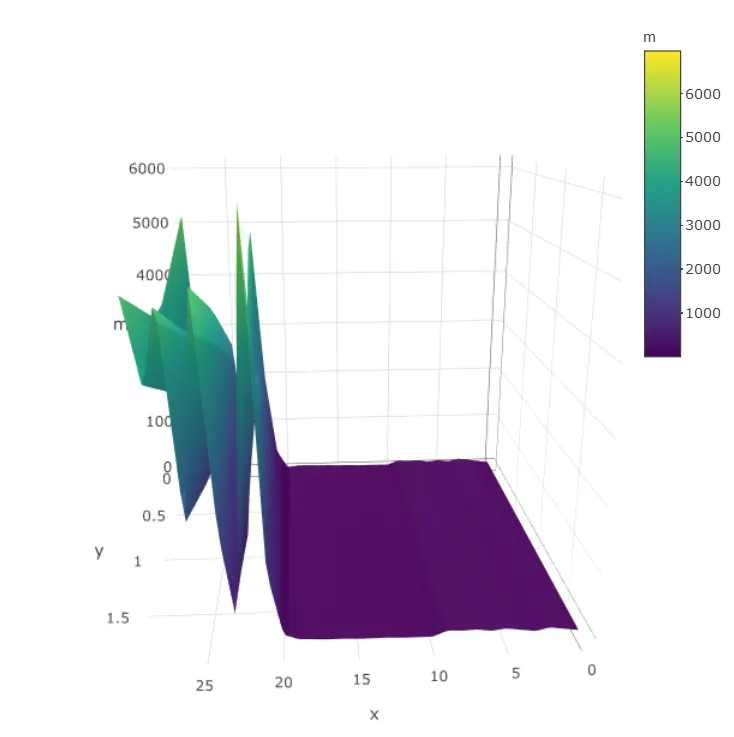
我想要一个表面图,但是我的网格不完整。我搜索了一下,但没有成功。如何使以下内容正常工作:
x = c(10L, 20L, 30L, 40L, 50L, 60L, 70L, 80L, 90L, 100L, 30L, 40L,
50L, 60L, 70L, 80L, 90L, 100L, 50L, 60L, 70L, 80L, 90L, 100L,
70L, 80L, 90L, 100L, 90L, 100L)
y = c(10L, 10L, 10L, 10L, 10L, 10L, 10L, 10L, 10L, 10L, 20L, 20L,
20L, 20L, 20L, 20L, 20L, 20L, 30L, 30L, 30L, 30L, 30L, 30L,
40L, 40L, 40L, 40L, 50L, 50L)
z = c(6.093955007, 44.329214443, 149.103755156, 351.517349974,
726.51174655, 1191.039562104, 1980.245204702, 2783.308022984,
6974.563519067, 5149.396230019, 142.236259009, 321.170609648,
684.959503897, 1121.475597135, 1878.334840961, 2683.116309688,
4159.60732066, 5294.774284119, 687.430547359, 1119.765405426,
1876.57337196, 2685.951176024, 3945.696884503, 5152.986796572,
1870.78724464, 2677.744176903, 3951.928931107, 5160.295960254,
3957.503273558, 5147.237754092)
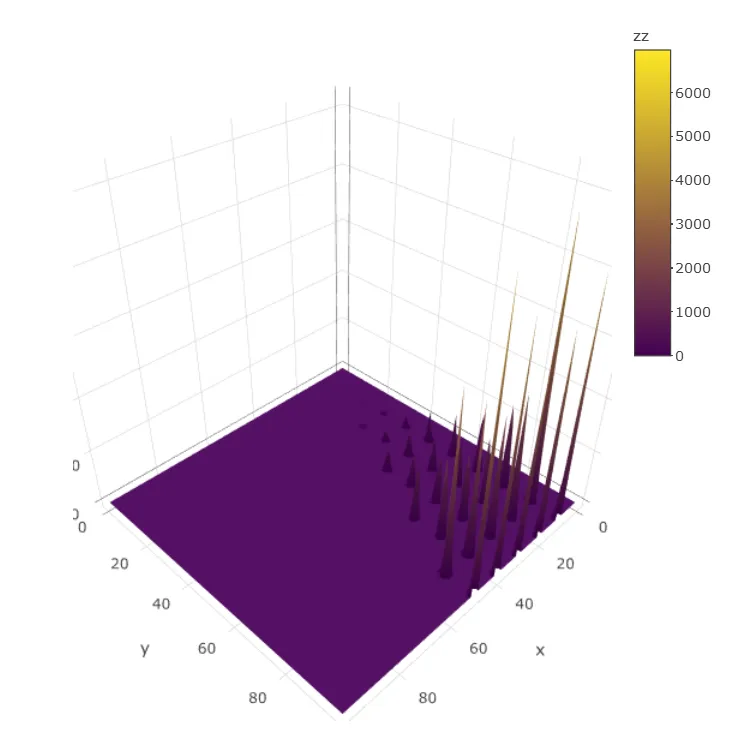
# OK but not a surface plot
scatterplot3d::scatterplot3d(x, y, z,
color = "blue", pch = 19,
type = "h",
main = "",
xlab = "x",
ylab = "y",
zlab = "z",
angle = 35,
grid = FALSE)
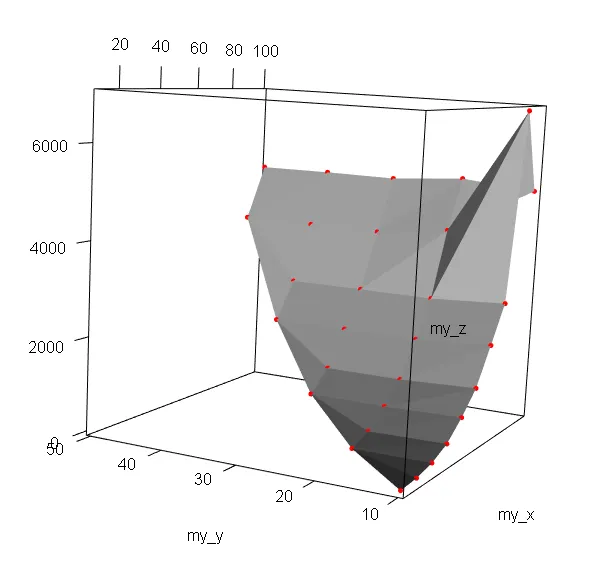
# Not working:
M <- plot3D::mesh(x, y, z)
R <- with (M, sqrt(x^2 + y^2 +z^2))
p <- sin(2*R)/(R+1e-3)
plot3D::slice3D(x, y, z, colvar = p,
xs = 0, ys = c(-4, 0, 4), zs = NULL)
plot3D::isosurf3D(x, y, z, colvar = p, level = 0, col = "red")