我有三个数据向量:X(位置)、Y(位置),它们都不是按规律排列的,还有Z(每个位置上的值)。我尝试使用contourf函数,但它需要一个矩阵作为Z输入,因此无法正常工作。
2个回答
9
你也可以使用
griddata。%Generate random data
x = rand(30,1);
y = rand(30,1);
z = rand(30,1);
%Create regular grid across data space
[X,Y] = meshgrid(linspace(min(x),max(x),n), linspace(min(y),max(y),n))
%create contour plot
contour(X,Y,griddata(x,y,z,X,Y))
%mark original data points
hold on;scatter(x,y,'o');hold off
- JMinton
7
要绘制一个等高线图,你需要有一个z值的矩阵或者在网格上评估出一组z值的向量。你不能使用网格上隔离的Z值在(X,Y)点上定义等高线(即你所声称拥有的)。
你需要生成过程(或函数)为网格上的(x,y)点提供值。
如果没有,那么你可以创建非均匀数据的曲面如@nate所指出的,然后在该曲面上绘制等高线。
考虑以下(随机)示例:
N = 64; % point set
x = -2 + 4*rand(N,1); % random x vector in[-2,2]
y = -2 + 4*rand(N,1); % random y vector in[-2,2]
% analytic function, or z-vector
z = x.*exp(-x.^2-y.^2);
% construct the interpolant function
F = TriScatteredInterp(x,y,z);
t = -2:.25:2; % sample uniformly the surface for matrices (qx, qy, qz)
[qx, qy] = meshgrid(t, t);
qz = F(qx, qy);
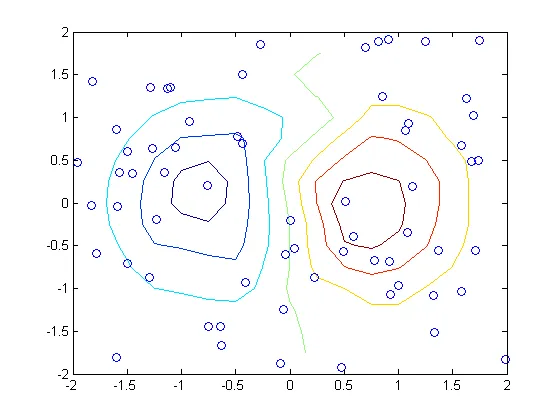
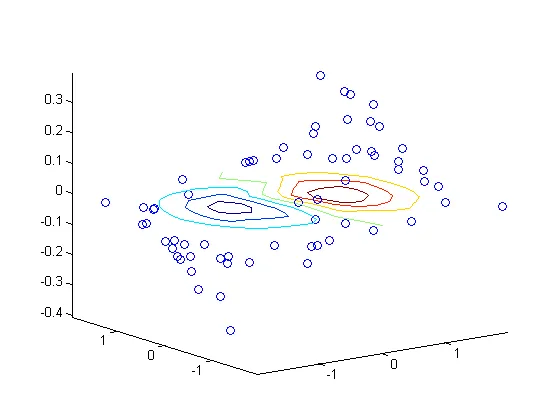
contour(qx, qy, qz); hold on;
plot(x,y,'bo'); hold off
这些圆圈对应于每个点的原始向量点,其值为
(x,y,z),轮廓线在插值曲面的轮廓线上。
- gevang
网页内容由stack overflow 提供, 点击上面的可以查看英文原文,
原文链接
原文链接
Z不是一个矩阵,那它是什么格式? - Florian Brucker