将文本值放置在桑基图的右侧

10
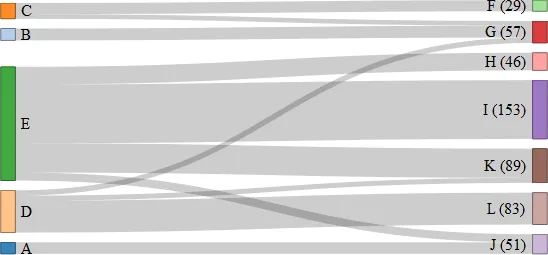
在使用networkD3渲染桑基图时,有没有什么技巧可以将文本放置在上面?我希望端点的值作为文本显示在它们的方框右侧。我知道悬停在方框上会显示该值,但是随着方框变小,在许多情况下,如果值始终在侧面可见,就会更容易表达信息。这里有一个例子; 我能够通过将值作为标签的一部分添加来进行某种形式的欺骗,但是最好在图表的右侧显示这些值。
library(networkD3)
library(data.table)
set.seed(1999)
links <- data.table(
  src = rep(0:4, times=c(1,1,2,3,5)),
  target = sample(1:11, 12, TRUE),
  value = sample(100, 12)
)[src < target, ]  # no loops
nodes <- data.table(name=LETTERS[1:12])

## Need to hover to get counts
sankeyNetwork(Links=links, Nodes=nodes, Source='src', Target='target',
  Value='value', NodeID='name', fontSize=16)

## Add text to label
txt <- links[, .(total = sum(value)), by=c('target')]
nodes[txt$target+1L, name := paste0(name, ' (', txt$total, ')')]

## Displays the counts as part of the labels
sankeyNetwork(Links=links, Nodes=nodes, Source='src', Target='target',
  Value='value', NodeID='name', fontSize=16, width=600, height=300)

enter image description here

1个回答

10

抱歉,我刚刚看到这个。这将是新的htmlwidgetsonRender函数的一个很好的用途。我试图通过行内注释来解释添加的几行JavaScript代码来移动节点文本。 networkD3这些行中过滤掉了宽度改变后的右侧或左侧布局。我们只需要将其应用于所有文本,使其位于节点矩形的右侧。

library(networkD3)
library(data.table)
set.seed(1999)
links <- data.table(
  src = rep(0:4, times=c(1,1,2,3,5)),
  target = sample(1:11, 12, TRUE),
  value = sample(100, 12)
)[src < target, ]  # no loops
nodes <- data.table(name=LETTERS[1:12])

## Need to hover to get counts
sankeyNetwork(Links=links, Nodes=nodes, Source='src', Target='target',
              Value='value', NodeID='name', fontSize=16)

## Add text to label
txt <- links[, .(total = sum(value)), by=c('target')]
nodes[txt$target+1L, name := paste0(name, ' (', txt$total, ')')]

## Displays the counts as part of the labels
sankeyNetwork(Links=links, Nodes=nodes, Source='src', Target='target',
              Value='value', NodeID='name', fontSize=16, width=600, height=300)


#################### move leaf node text right ################
# for this to work
#   install the newest htmlwidgets
#   devtools::install_github("ramnathv/htmlwidgets")

library(htmlwidgets)
#  add margin left since we'll need extra room
#   if you are wondering why margin left,
#   I think we just discovered a bug
sn <- sankeyNetwork(
  Links=links, Nodes=nodes, Source='src', Target='target',
  Value='value', NodeID='name', fontSize=16,
  width=600, height=300,
  # give us so room for our newly aligned labels
  margin = list("left"=100)
)
# see how it looks
sn

# now let's use the new htmlwidget function
#  onRender
onRender(
  sn,
'
function(el,x){
  // select all our node text
  var node_text = d3.select(el)
    .selectAll(".node text")
    //and make them match
    //https://github.com/christophergandrud/networkD3/blob/master/inst/htmlwidgets/sankeyNetwork.js#L180-L181
    .attr("x", 6 + x.options.nodeWidth)
    .attr("text-anchor", "start");
}
'
)

网页内容由stack overflow 提供, 点击上面的
可以查看英文原文,
原文链接