在Python中绘制桑基图
14
- nazca
2
你需要/期望什么样的输出? - Martin v. Löwis
尝试使用D3Blocks库。它是用Python编写的,但使用了d3.js的功能。https://d3blocks.github.io/d3blocks - erdogant
5个回答

3
您可以使用来自Plotly Dash的桑基图。
一个基本的图例示例,从上面的链接修改:
一个基本的图例示例,从上面的链接修改:
import plotly.graph_objects as go

fig = go.Figure(data=[go.Sankey(
    node = dict(
      pad = 15,
      thickness = 20,
      line = dict(color = "black", width = 0.5),
      label = ["A1", "A2", "B1", "B2", "C1", "C2"],
      color = "green"
    ),
    link = dict(
      source = [0, 1, 0, 2, 3, 3], # indices correspond to labels, eg A1, A2, A1, B1, ...
      target = [2, 3, 3, 4, 4, 5],
      value = [7, 5, 3, 9, 5, 3]
  ))])

fig.update_layout(title_text="Simple Sankey Diagram using plotly in Python.", font_size=10)
fig.show()
- Sri Test
1
传奇!!- 这帮了我! - Scott85044
2
我在Google上搜索了“Python图形可视化”,找到了一些资料。有几个库具有“弹簧”行为,其中软件平衡图表并使其美观;它们为您完成了大部分工作。但是它们绘制的是具有节点和边缘的图形图表,与桑基图不同。
在Google上搜索“Python桑基图”没有产生有用的结果。
我在Google上搜索了“Python矢量图形”,发现这个非常有前途的结果:
此外,还可以参考StackOverflow关于在Python中绘制矢量图的讨论:svg diagrams using python 该页面引导我到:http://cairographics.org/,看起来非常有用。
您提供的博客文章中有一篇关于自动生成Sankey图的文章。
在Google上搜索“Python桑基图”没有产生有用的结果。
我在Google上搜索了“Python矢量图形”,发现这个非常有前途的结果:
http://pypi.python.org/pypi/Things
使用Things,显然您可以在Inkscape(一款免费的矢量编辑程序)中绘制基本形状,然后编写Python代码来缩放、旋转等等这些形状,以生成图像或动画。应该可以编写Python代码自动使Sankey箭头从其源点弹出,向上、向下或其他方向转向。此外,还可以参考StackOverflow关于在Python中绘制矢量图的讨论:svg diagrams using python 该页面引导我到:http://cairographics.org/,看起来非常有用。
您提供的博客文章中有一篇关于自动生成Sankey图的文章。
http://www.sankey-diagrams.com/sankey-diagrams-are-directed-weighted-graphs/
http://www.svgopen.org/2003/papers/RenderingGraphs/index.html
我没有为您找到一个完整的解决方案,但我找到了一些部件,可能可以用于解决方案。祝你好运。- steveha
2
在我的研究小组中,我们使用Python中的Sankey图表,并在Jupyter笔记本中使用开源项目(注意:我是这些项目的开发者),将基于D3/SVG的Sankey嵌入输出中。
- floWeaver为绘制Sankey图表所需的数据聚合提供了更多的结构,
- ipysankeywidget仅绘制Sankey图表。
- ricklupton
0
其他答案提供了许多好的选项。然而,我想要一个能够与Matplotlib一起使用,但看起来更像sankeymatic图表的东西。
我发现了pySankey,但它只允许双射流的一级。
最终我编写了一个包SankeyFlow。它纯粹使用Matplotlib,并生成如下的流程。
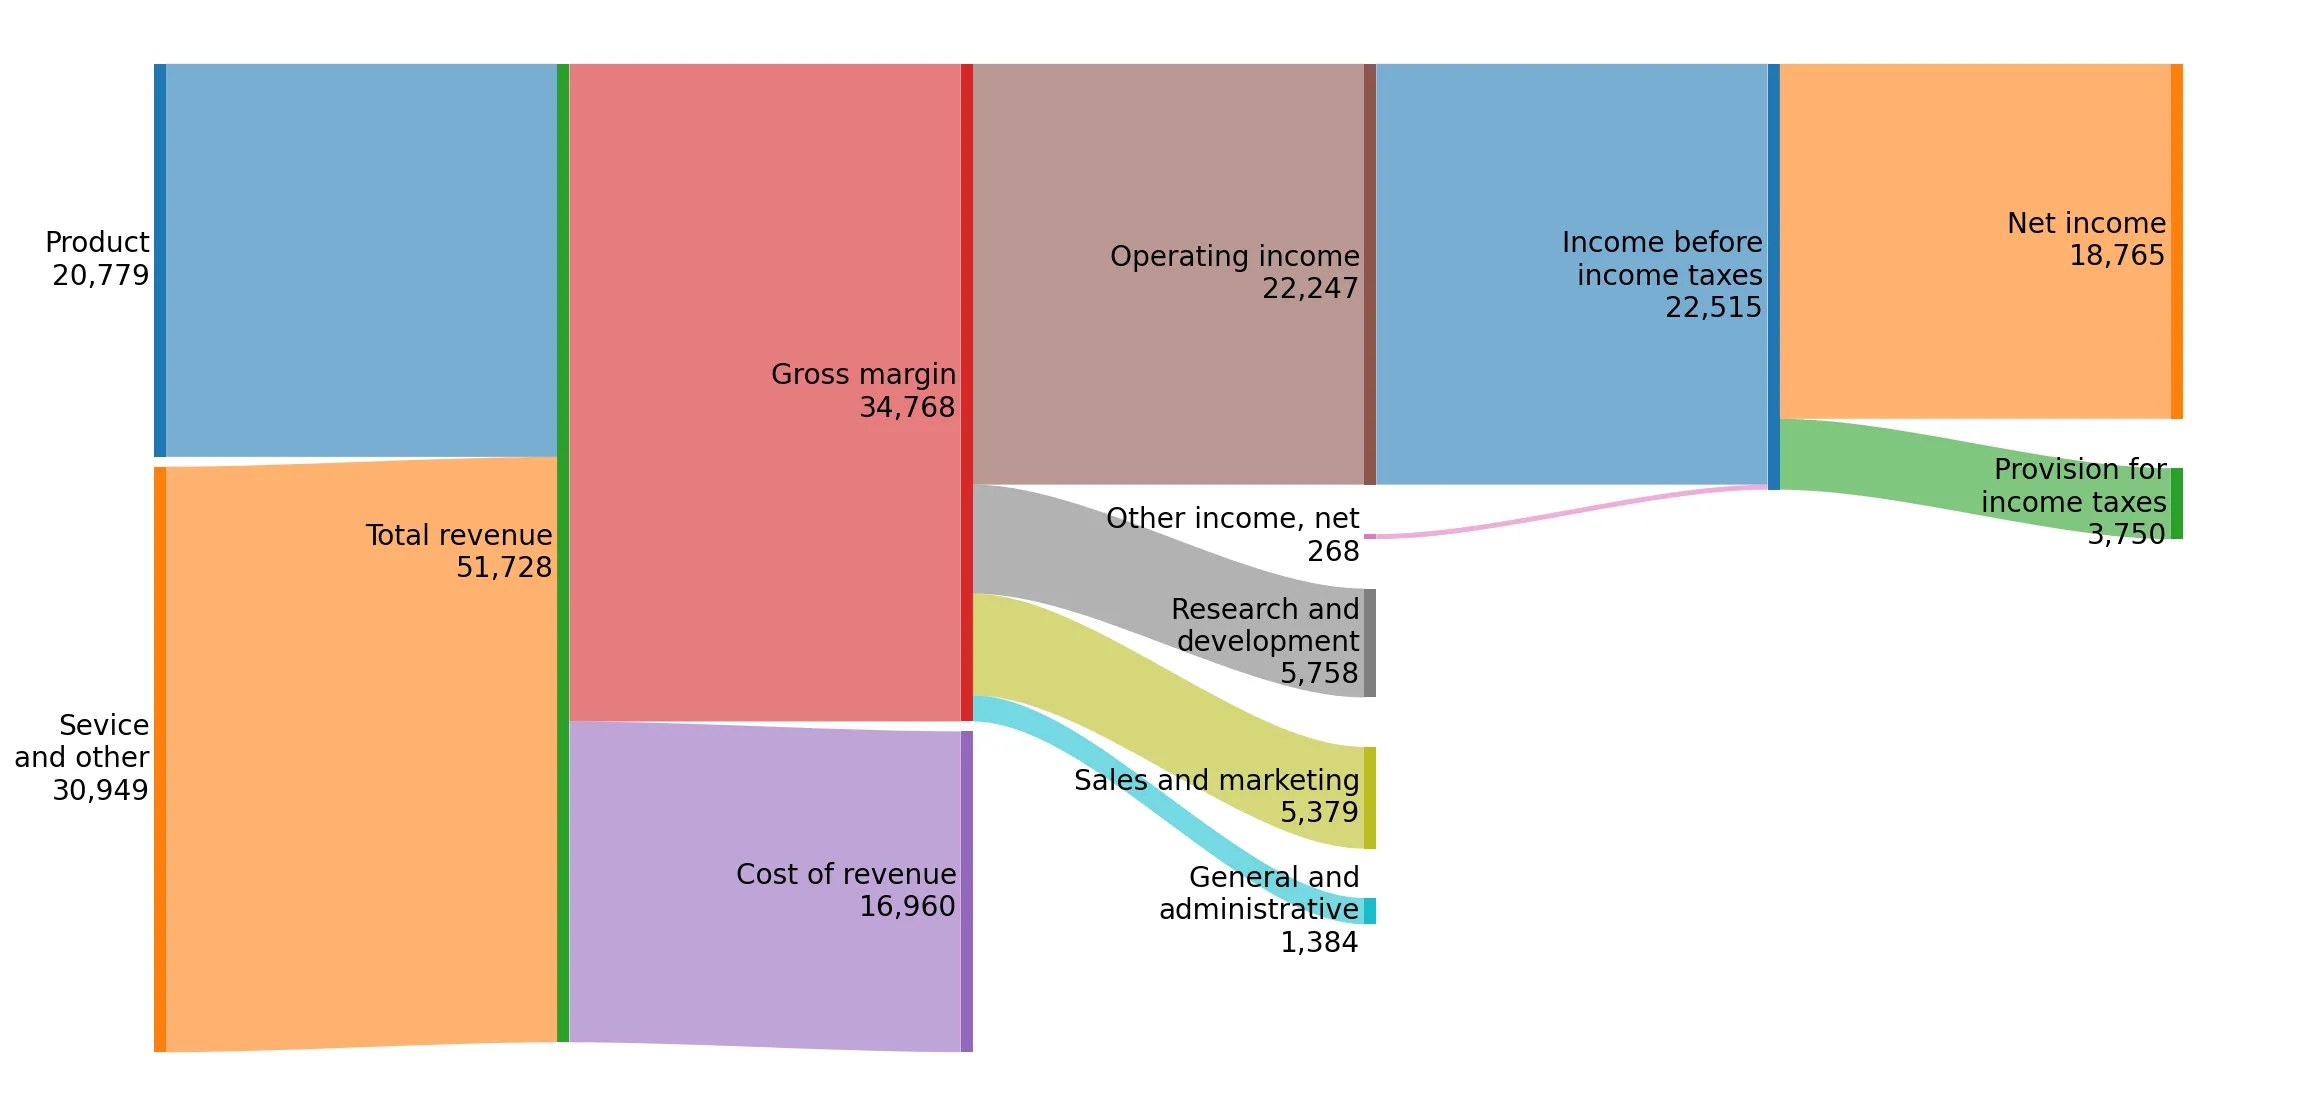
from sankeyflow import Sankey
import matplotlib.pyplot as plt

plt.figure(figsize=(20, 10), dpi=144)

flows = [
    ('Product', 'Total revenue', 20779),
    ('Sevice\nand other', 'Total revenue', 30949),
    ('Total revenue', 'Gross margin', 34768),
    ('Total revenue', 'Cost of revenue', 16960),
    ('Gross margin', 'Operating income', 22247),
    ('Operating income', 'Income before\nincome taxes', 22247, {'flow_color_mode': 'dest'}),
    ('Other income, net', 'Income before\nincome taxes', 268),
    ('Gross margin', 'Research and\ndevelopment', 5758),
    ('Gross margin', 'Sales and marketing', 5379),
    ('Gross margin', 'General and\nadministrative', 1384),
    ('Income before\nincome taxes', 'Net income', 18765),
    ('Income before\nincome taxes', 'Provision for\nincome taxes', 3750),
]

s = Sankey(flows=flows, flow_color_mode='lesser')
s.draw()
plt.show()
- rileyx
网页内容由stack overflow 提供, 点击上面的可以查看英文原文,
原文链接
原文链接
- 相关问题
- 11 控制桑基图连接
- 4 使用networkD3包的桑基图无法绘制。
- 10 在选项卡中调整桑基图
- 3 R中的桑基图
- 4 根据时间序列数据帧绘制桑基图。
- 17 Plotly:如何从数据框绘制桑基图?
- 23 桑基图转换
- 92 如何在R中绘制桑基图?
- 8 在Shiny中打印桑基图
- 3 桑基图可视化