使用networkD3包的桑基图无法绘制。

4

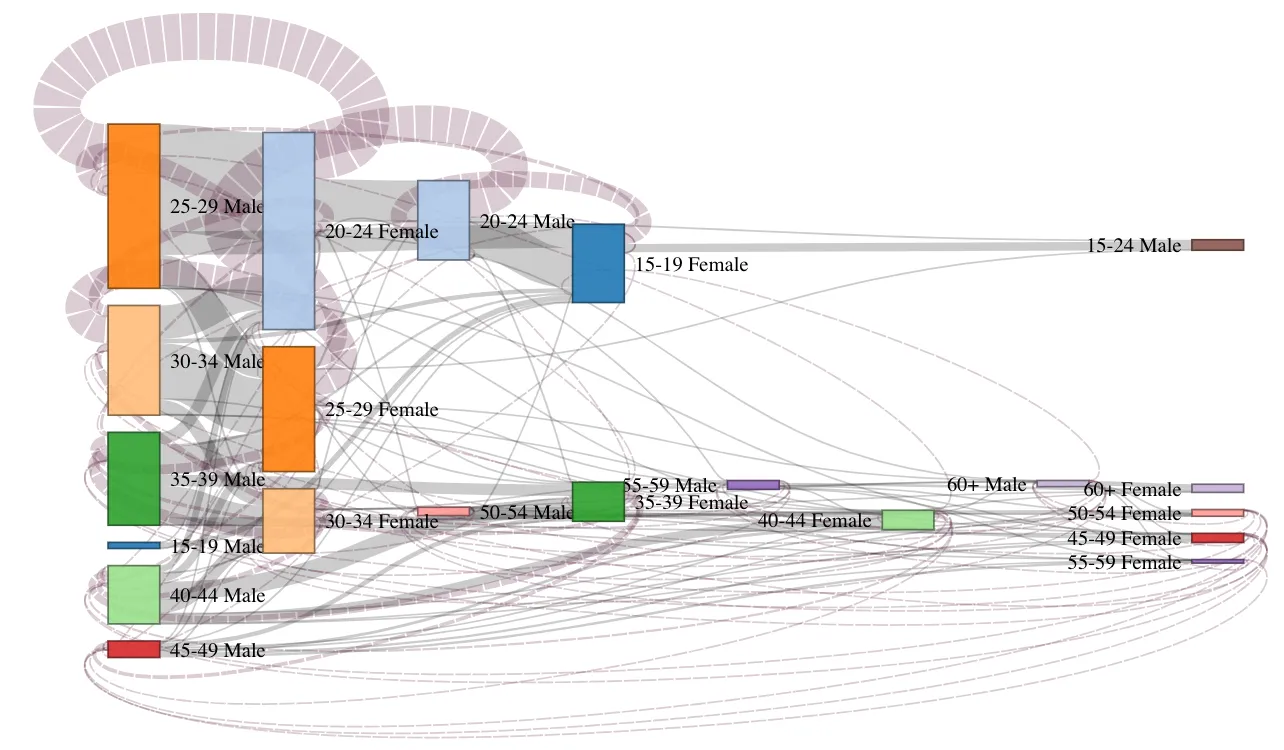
我正在使用R中networkD3包中的sankeyNetwork函数,以这里找到的代码为例。然而,我得到的结果是一个空白屏幕。该图表应显示不同年龄组(按性别)之间感染流动情况。我的代码如下:

library(RCurl)
library(networkD3)

edges <- read.csv(curl("https://raw.githubusercontent.com/kilimba/data/master/infection_flows.csv"),stringsAsFactors = FALSE )

nodes = data.frame(ID = unique(c(edges$Source, edges$Target)))

nodes$indx =0
for (i in 1:nrow(nodes)){
  nodes[i,]["indx"] = i - 1
}

edges2 <- merge(edges,nodes,by.x = "Source",by.y = "ID")
edges2$Source <-NULL
names(edges2) <- c("target","value","source")
edges2 <- merge(edges2,nodes,by.x = "target",by.y = "ID")
edges2$target <- NULL
names(edges2) <- c("value","source","target")

nodes$indx <- NULL
# Plot
sankeyNetwork(Links = edges2, Nodes = nodes,
              Source = "source", Target = "target",
              Value = "value", NodeID = "ID",
              width = 700, fontsize = 12, nodeWidth = 30)

我面临同样的问题。sankeyNetwork可以处理我使用的数据集的较小样本,但如果尝试使用完整数据集,则会显示一个空白屏幕。 - Kinjal
4个回答

1
你确定在R控制台中没有打印出任何错误吗?
我对此进行了两个小修改,这样就可以正常工作:
  1. Load the curl package as well at the beginning

    library("curl")
    
  2. The fontsize parameter apparently does not work and should be removed.

    # Plot
    sankeyNetwork(Links = edges2, Nodes = nodes,
          Source = "source", Target = "target",
          Value = "value", NodeID = "ID",
          width = 700, #fontsize = 12,
          nodeWidth = 30)
    

1
调整字体大小确实有效,但您的参数缺少大写: fontSize
sankeyNetwork(Links = edges2, Nodes = nodes,
  Source = "source", Target = "target",
  Value = "value", NodeID = "ID",
  width = 700, fontSize = 12,
  nodeWidth = 30)

1
  1. 你不需要使用RCurlread.csv能够直接从URL读取
  2. 创建节点数据框时,使用stringsAsFactors = FALSE选项可能更安全
  3. 正如其他人指出的那样,你必须确保链接数据中的源变量和目标变量是数字,并且它们是从零开始索引的
  4. 正如其他人指出的那样,字体大小参数应该被正确命名为fontSize
  5. 我提供了一种更直接的方法来创建具有节点数据框中节点的数字索引的链接数据
library(networkD3)

edges <- read.csv("https://raw.githubusercontent.com/kilimba/data/master/infection_flows.csv",stringsAsFactors = FALSE)

nodes = data.frame(ID = unique(c(edges$Source, edges$Target)), stringsAsFactors = FALSE)

edges$Source <- match(edges$Source, nodes$ID) - 1
edges$Target <- match(edges$Target, nodes$ID) - 1

sankeyNetwork(Links = edges, Nodes = nodes,
              Source = "Source", Target = "Target",
              Value = "Value", NodeID = "ID",
              width = 700, fontSize = 12, nodeWidth = 30)

enter image description here


0

我通过确保源、目标和值都是数字来解决了我的问题。

例如: Energy$links$value <- as.numeric(Energy$links$value)


提问者已经发布了一段代码,答案应该在那段代码中显示,检查其他回答者的答案。 - Ibo

网页内容由stack overflow 提供, 点击上面的
可以查看英文原文,
原文链接