我想使用Python绘制树状图,包括决策树、组织结构图等。 有没有任何库可以帮助我实现这个目标?
6个回答
46
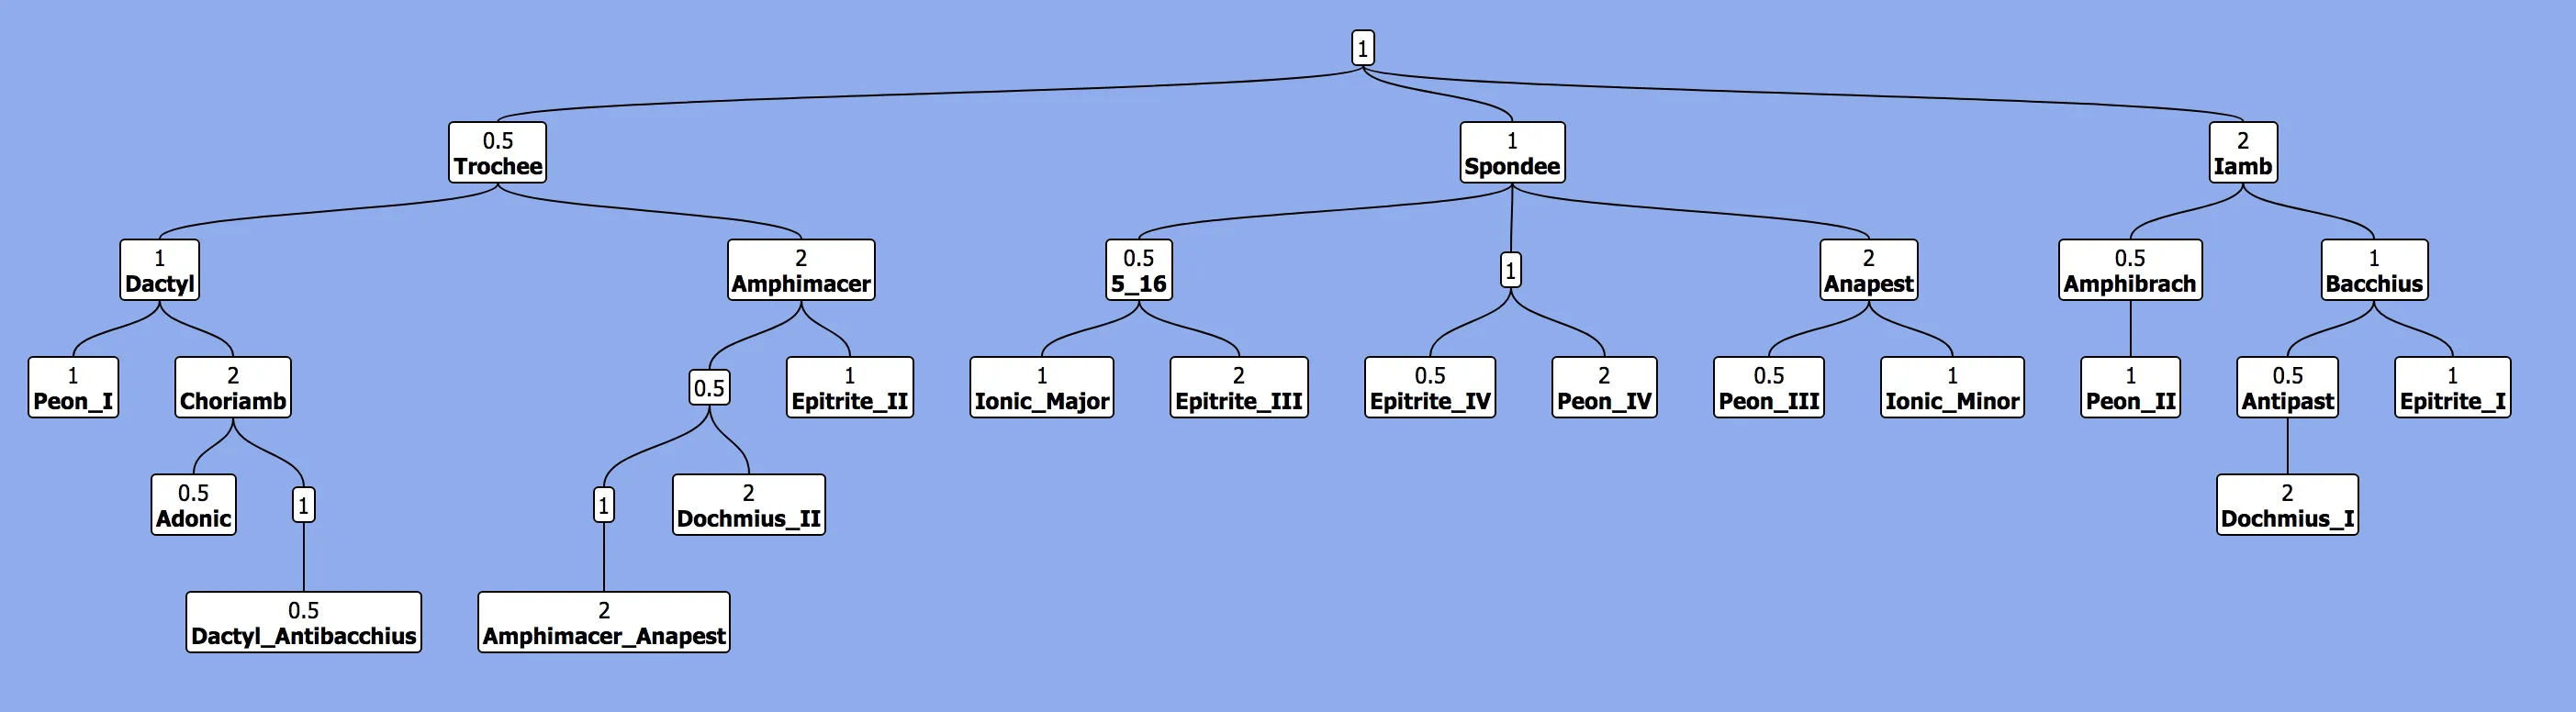
对于基本可视化,我会考虑使用treelib。
它非常直观和易于使用:
 from treelib import Node, Tree

 tree = Tree()

 tree.create_node("Harry", "harry")  # No parent means its the root node
 tree.create_node("Jane",  "jane"   , parent="harry")
 tree.create_node("Bill",  "bill"   , parent="harry")
 tree.create_node("Diane", "diane"  , parent="jane")
 tree.create_node("Mary",  "mary"   , parent="diane")
 tree.create_node("Mark",  "mark"   , parent="jane")

 tree.show()
输出:
Harry
├── Bill
└── Jane
    ├── Diane
    │   └── Mary
    └── Mark
- RtmY
1
8非常感激您的贡献,确实易于使用。此外,一旦您构建了一棵树,还有一个不错的方法可以生成树的Graphviz格式:
tree.to_graphviz()。因此,您可以在任何在线或离线工具中使用它。 - Klim39
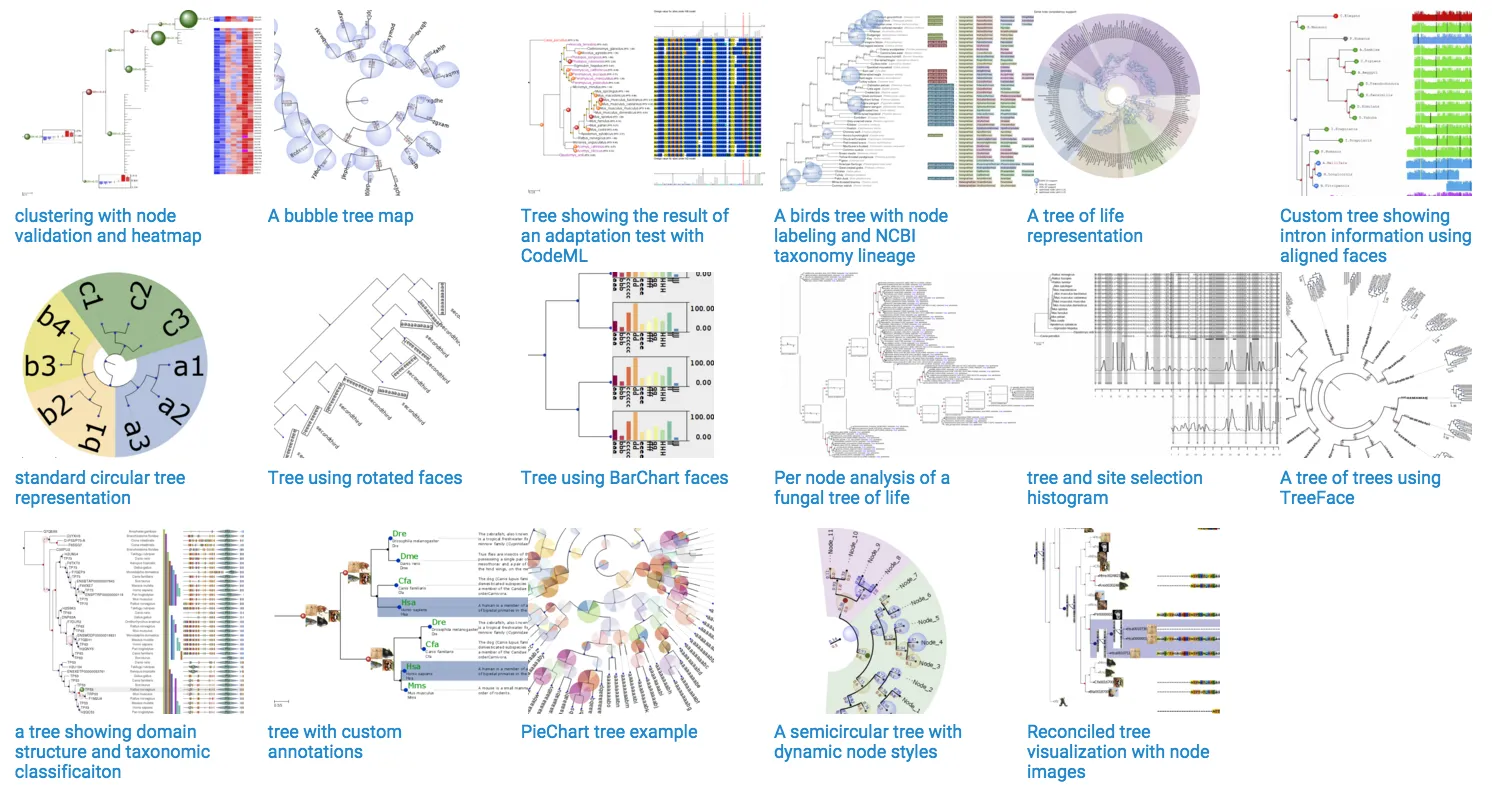
有一个叫做graphviz的工具 - http://www.graphviz.org/,它使用“DOT”语言来绘制图形。您可以自己生成DOT代码,也可以使用pydot - https://github.com/pydot/pydot。您还可以使用networkx - http://networkx.lanl.gov/tutorial/tutorial.html#drawing-graphs,它可以轻松地将图形绘制到graphviz或matplotlib中。
networkx + matplotlib + graphviz给您带来了最大的灵活性和强大的功能,但您需要安装很多依赖。
如果您想要快速解决问题,请尝试:
安装Graphviz。
open('hello.dot','w').write("digraph G {Hello->World}")
import subprocess
subprocess.call(["path/to/dot.exe","-Tpng","hello.dot","-o","graph1.png"])
# I think this is right - try it form the command line to debug
你需要安装pydot,因为pydot已经可以自动完成这件事了。然后你可以使用networkx来“驱动”pydot。
- wisty
5
NetworX看起来很不错。唯一的问题是我需要一个外部库来生成图像文件。我能生成节点之间的弧线吗? - Injeniero Barsa
哪个库?NetworkX可以处理几个不同的库。它们似乎喜欢Matplotlib,这里有一个安装指南:http://matplotlib.sourceforge.net/users/installing.html。 - wisty
Matplotlib 不支持独立的图表。 - Injeniero Barsa
NetworkX。Graphviz在历史上因读取“DOT”文件而闻名,但在我看来,NetworkX、Ete和iGraph按照现代标准产生了更好的结果,并且不需要将另一种语言与Python混合使用。 - c z
2NetworkX网站链接已经失效。新链接:https://networkx.org/documentation/stable/tutorial.html#drawing-graphs - Abdelhakim AKODADI
6
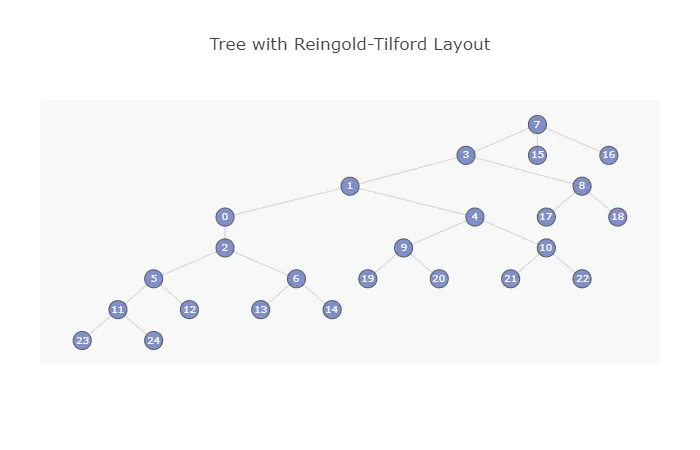
Plotly可以使用igraph绘制树形图。现在您也可以离线使用它。下面的示例旨在在Jupyter笔记本中运行。
import plotly.plotly as py
import plotly.graph_objs as go

import igraph
from igraph import *
# I do not endorse importing * like this

#Set Up Tree with igraph

nr_vertices = 25
v_label = map(str, range(nr_vertices))
G = Graph.Tree(nr_vertices, 2) # 2 stands for children number
lay = G.layout('rt')

position = {k: lay[k] for k in range(nr_vertices)}
Y = [lay[k][1] for k in range(nr_vertices)]
M = max(Y)

es = EdgeSeq(G) # sequence of edges
E = [e.tuple for e in G.es] # list of edges

L = len(position)
Xn = [position[k][0] for k in range(L)]
Yn = [2*M-position[k][1] for k in range(L)]
Xe = []
Ye = []
for edge in E:
    Xe+=[position[edge[0]][0],position[edge[1]][0], None]
    Ye+=[2*M-position[edge[0]][1],2*M-position[edge[1]][1], None]

labels = v_label

#Create Plotly Traces

lines = go.Scatter(x=Xe,
                   y=Ye,
                   mode='lines',
                   line=dict(color='rgb(210,210,210)', width=1),
                   hoverinfo='none'
                   )
dots = go.Scatter(x=Xn,
                  y=Yn,
                  mode='markers',
                  name='',
                  marker=dict(symbol='dot',
                                size=18,
                                color='#6175c1',    #'#DB4551',
                                line=dict(color='rgb(50,50,50)', width=1)
                                ),
                  text=labels,
                  hoverinfo='text',
                  opacity=0.8
                  )

# Create Text Inside the Circle via Annotations

def make_annotations(pos, text, font_size=10,
                     font_color='rgb(250,250,250)'):
    L=len(pos)
    if len(text)!=L:
        raise ValueError('The lists pos and text must have the same len')
    annotations = go.Annotations()
    for k in range(L):
        annotations.append(
            go.Annotation(
                text=labels[k], # or replace labels with a different list
                                # for the text within the circle
                x=pos[k][0], y=2*M-position[k][1],
                xref='x1', yref='y1',
                font=dict(color=font_color, size=font_size),
                showarrow=False)
        )
    return annotations

# Add Axis Specifications and Create the Layout

axis = dict(showline=False, # hide axis line, grid, ticklabels and  title
            zeroline=False,
            showgrid=False,
            showticklabels=False,
            )

layout = dict(title= 'Tree with Reingold-Tilford Layout',
              annotations=make_annotations(position, v_label),
              font=dict(size=12),
              showlegend=False,
              xaxis=go.XAxis(axis),
              yaxis=go.YAxis(axis),
              margin=dict(l=40, r=40, b=85, t=100),
              hovermode='closest',
              plot_bgcolor='rgb(248,248,248)'
              )

# Plot

data=go.Data([lines, dots])
fig=dict(data=data, layout=layout)
fig['layout'].update(annotations=make_annotations(position, v_label))
py.iplot(fig, filename='Tree-Reingold-Tilf')
# use py.plot instead of py.iplot if you're not using a Jupyter notebook
- KevinH
4
我从这里得到一个难以理解的错误信息:
DeprecationWarning Traceback (most recent call last) <ipython-input-44-cfbb1d309447> in <module>() ----> 4 import igraph DeprecationWarning: 为避免与igraph项目名称冲突,此可视化库已更名为 'jgraph'。 请在方便时升级. 我不知道要升级什么:igraph、jgraph或其他东西。 我有所有东西的最新版本。 重写您的代码以引用“jgraph”并未起作用。 “pip install jgraph”没有起作用:jgraph没有Graph成员等。 :( - Reb.Cabin找到了一个可能的答案:https://dev59.com/e1oV5IYBdhLWcg3weevH - Reb.Cabin
我已经让它工作了,但需要设置一个plotly账户,所以我寻找免费的替代方案。python-igraph(不是igraph)在其中具有一些绘图功能http://igraph.org/python/doc/tutorial/tutorial.html。它很难安装;在Mac OS X上,经过痛苦的探索,“brew install cairo”被证明是必要且足够的。 - Reb.Cabin
为什么我会收到TypeError:类型为'map'的对象没有len()的错误? - Jesse Adam
3
针对2021年的解决方案,我编写了一个TreantJS库的Python包装器。该软件包创建一个带有树形可视化的HTML文件。用户可以选择调用R的webshot库来渲染树的高分辨率截图。由于该软件包相当新,请在问题中提出任何PR、错误报告或功能请求!详情见: https://github.com/Luke-Poeppel/treeplotter。
该软件包具有一些令人烦恼的安装要求(请参阅Installation.md),所以我编写了一个MacOS安装助手(已在Catalina和Big Sur上测试)。欢迎提供任何减少这些限制的提示。

- Luke Poeppel
1
这是一个实验性的特性,但 Google 提供了GraphViz api。如果你只想快速可视化一张图表,而不需要安装任何软件,这是非常方便的。
- Austin Marshall
1
3这个API已经被弃用并关闭。 - Ivelin
网页内容由stack overflow 提供, 点击上面的可以查看英文原文,
原文链接
原文链接
pip install安装并且可以直接运行的软件包。 - c z