我想使用一个以字典形式表示的颜色映射(即{leaf: color})来为我的聚类结果着色。
我尝试按照https://joernhees.de/blog/2015/08/26/scipy-hierarchical-clustering-and-dendrogram-tutorial/的教程进行,但是出现了混乱的颜色。默认的绘图效果还不错,我只是想分配不同的颜色。我看到有一个link_color_func,但是当我尝试使用我的颜色映射(D_leaf_color字典)时,由于它不是函数,因此出现了错误。我创建了D_leaf_color来自定义与特定聚类关联的叶子的颜色。在我的实际数据集中,这些颜色具有特定意义,因此我不想使用任意的颜色分配。
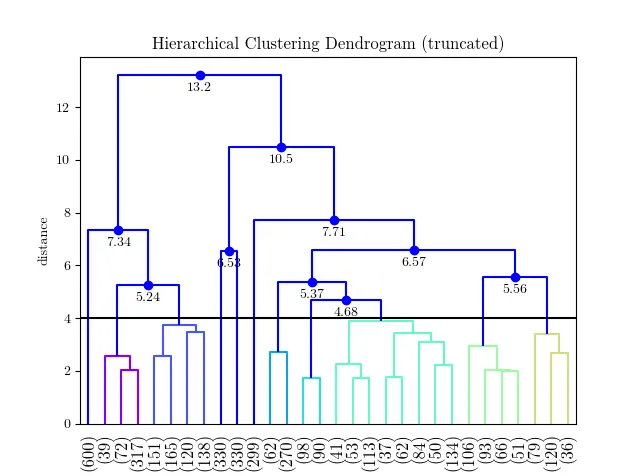
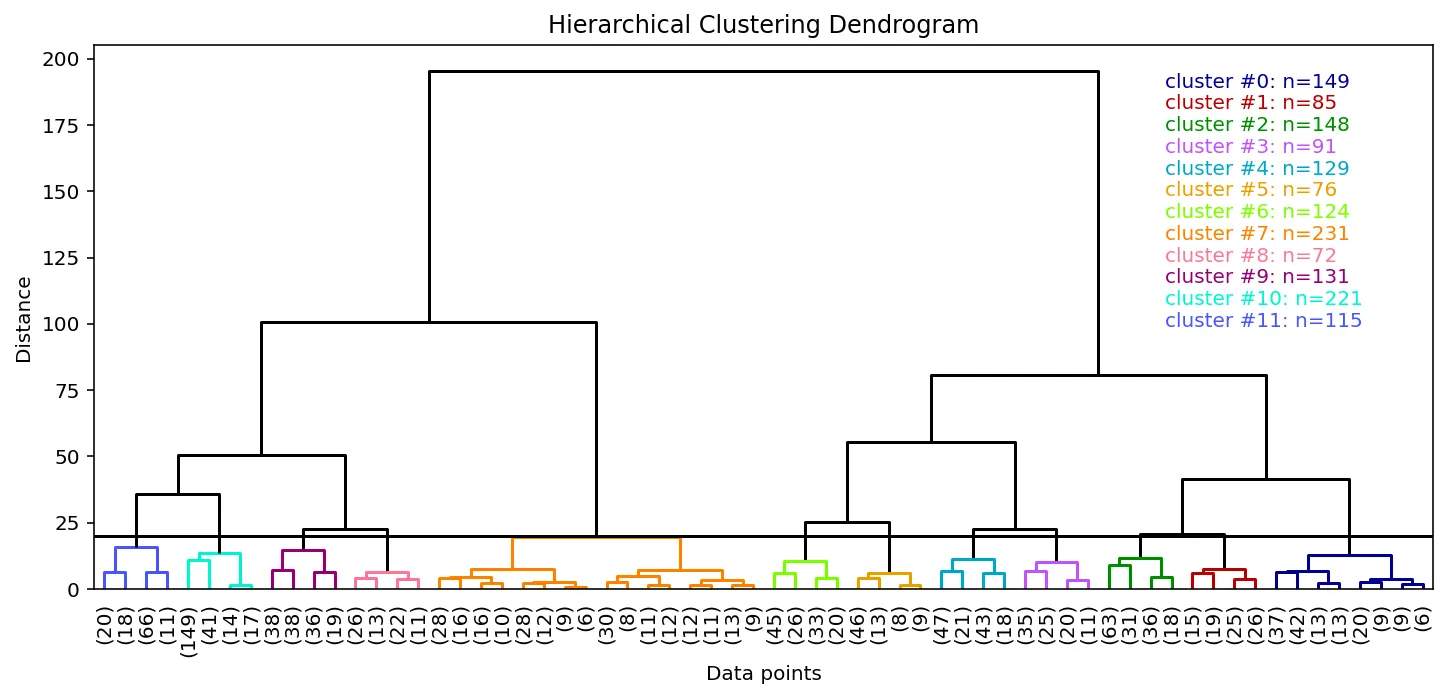
我不想使用color_threshold,因为在我的实际数据中,我有更多的聚类,SciPy会重复使用颜色,因此出现了这个问题...
如何使用我的叶子颜色字典自定义树状图聚类的颜色?
我在GitHub上提出了一个问题https://github.com/scipy/scipy/issues/6346,其中进一步阐述了在解释SciPy的层次聚类树状图输出?(也许发现了一个bug...)中着色叶子的方法,但是我仍然无法弄清楚如何实际执行以下操作:(i)使用树状图输出重构我的树状图,并使用指定的颜色字典,或者(ii)重新格式化我的D_leaf_color字典以适用于link_color_func参数。
# Init
import pandas as pd
import numpy as np
import matplotlib.pyplot as plt
import seaborn as sns; sns.set()
# Load data
from sklearn.datasets import load_diabetes
# Clustering
from scipy.cluster.hierarchy import dendrogram, fcluster, leaves_list
from scipy.spatial import distance
from fastcluster import linkage # You can use SciPy one too
%matplotlib inline
# Dataset
A_data = load_diabetes().data
DF_diabetes = pd.DataFrame(A_data, columns = ["attr_%d" % j for j in range(A_data.shape[1])])
# Absolute value of correlation matrix, then subtract from 1 for disimilarity
DF_dism = 1 - np.abs(DF_diabetes.corr())
# Compute average linkage
A_dist = distance.squareform(DF_dism.as_matrix())
Z = linkage(A_dist,method="average")
# Color mapping
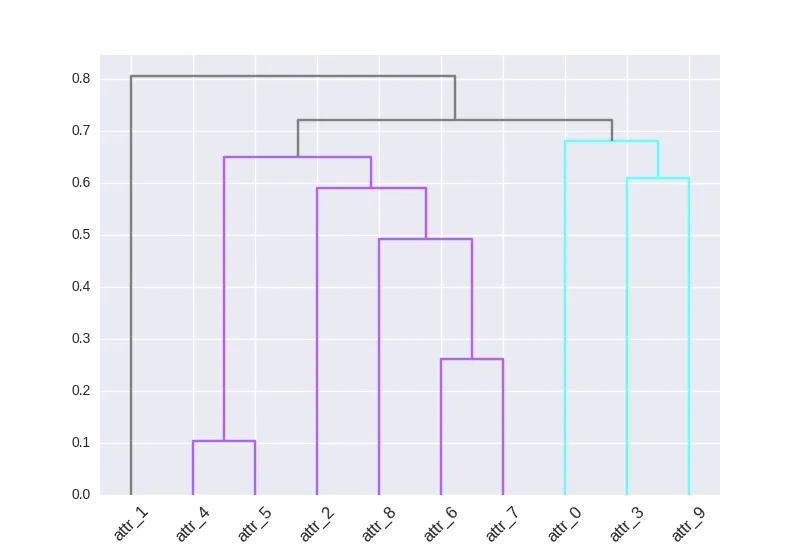
D_leaf_colors = {"attr_1": "#808080", # Unclustered gray
"attr_4": "#B061FF", # Cluster 1 indigo
"attr_5": "#B061FF",
"attr_2": "#B061FF",
"attr_8": "#B061FF",
"attr_6": "#B061FF",
"attr_7": "#B061FF",
"attr_0": "#61ffff", # Cluster 2 cyan
"attr_3": "#61ffff",
"attr_9": "#61ffff",
}
# Dendrogram
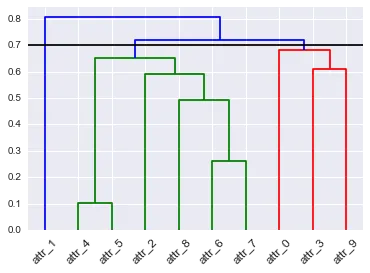
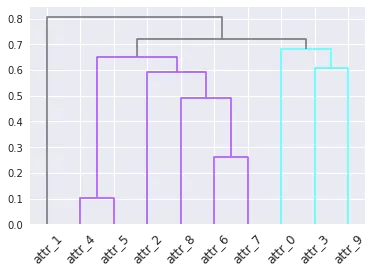
# To get this dendrogram coloring below `color_threshold=0.7`
D = dendrogram(Z=Z, labels=DF_dism.index, color_threshold=None, leaf_font_size=12, leaf_rotation=45, link_color_func=D_leaf_colors)
# TypeError: 'dict' object is not callable
leaf_colors?如果是这样,难道您不能从聚类中生成链接颜色吗? - BrenBarnfcluster获得颜色,因为fcluster仅返回平面聚类,并且丢弃有关较低级别聚类的信息。您需要完整的链接结构。 - BrenBarnfcluster中获得一个长度为n的数组,其中n是我正在进行聚类的样本数量。该数组的每个索引都有簇编号。我同时迭代该数组和原始标签,将样本分配到簇中。 - O.rka