我有一个表示树形结构的复杂单元格:
CellArray = {1,1,1,{1,1,1,{1,1,{1,{1 1 1 1 1 1 1 1}, 1,1}, 1,1},1,1,1},1,1,1,{1,1,1,1}};
我想通过使用treeplot(p)绘制相关树形结构,但不确定如何构建数组p以正确显示。
我有一个表示树形结构的复杂单元格:
CellArray = {1,1,1,{1,1,1,{1,1,{1,{1 1 1 1 1 1 1 1}, 1,1}, 1,1},1,1,1},1,1,1,{1,1,1,1}};
我想通过使用treeplot(p)绘制相关树形结构,但不确定如何构建数组p以正确显示。
function treearray = getTreeArray(cellarray)
    % initialise the array construction from node 0
    treearray = [0, treebuilder(cellarray, 1)];
    % recursive tree building function, pass it a cell array and root node
    function [out, node] = treebuilder(cellarray, rnode)
        % Set up variables to be populated whilst looping
        out = [];
        % Start node off at root node
        node = rnode;
        % Loop over cell array elements, either recurse or add node
        for ii = 1:numel(cellarray)
            tb = []; node = node + 1;
            if iscell(cellarray{ii})
                [tb, node] = treebuilder(cellarray{ii}, node);
            end
            out = [out, rnode, tb];
        end
    end
end
这是一个比你的更简单的示例,因此我们可以轻松地检查逻辑是否有效。
myCellArray = {1 1 {1 1 1 {1 1 1}}};
% This cell array has 3 levels:
% - 3 child nodes (2,3,4) of the root node (1)
% - Last node on the first level (4) has 4 children:
%     - 4 child nodes on second level (5,6,7,8)
%     - Last node on the first level (8) has 3 children:
%         - 3 child nodes on third level (9,10,11)
myTreeArray = getTreeArray(myCellArray);
% Output, we see the corresponding nodes as listed above:
% [0 1 1 1 4 4 4 4 8 8 8]
treeplot(myTreeArray)
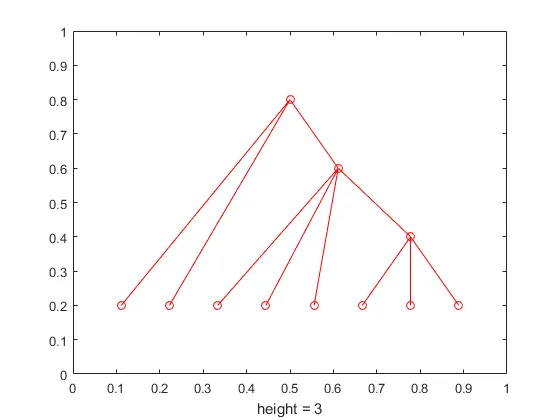
我认为这个按预期工作,注意你不必定义myCellArray或myTreeArray变量:
treeplot(getTreeArray({1,1,1,{1,1,1,{1,1,{1,{1 1 1 1 1 1 1 1}, 1,1}, 1,1},1,1,1},1,1,1,{1,1,1,1}}))
treelayout获取节点位置并在构建树状数组时遇到值时进行跟踪来标记节点。应调整函数以实现此“跟踪”操作,如下所示:function [treearray, nodevals] = getTreeArray(cellarray)
% initialise the array construction from node 0
[nodes, ~, nodevals] = treebuilder(cellarray, 1);
treearray = [0, nodes];
% recursive tree building function, pass it a cell array and root node
function [out, node, nodevals] = treebuilder(cellarray, rnode)
% Set up variables to be populated whilst looping
out = []; nodevals = {};
% Start node off at root node
node = rnode;
% Loop over cell array elements, either recurse or add node
for ii = 1:numel(cellarray)
node = node + 1;
if iscell(cellarray{ii})
[tb, node, nv] = treebuilder(cellarray{ii}, node);
out = [out, rnode, tb];
nodevals = [nodevals, nv];
else
out = [out, rnode];
nodevals = [nodevals, {node; cellarray{ii}}];
end
end
end
end
nodevals存储在矩阵中,这样可以缩短后期格式化的时间。% Run the tree building script above
[treearray, nodevals] = getTreeArray(myCellArray);
% Plot
treeplot(treearray);
% Get the position of each node on the plot
[x,y] = treelayout(treearray);
% Get the indices of the nodes which have values stored
nodeidx = cell2mat(nodevals(1,:));
% Get the labels (values) corresponding to those nodes. Must be strings in cell array
labels = cellfun(@num2str, nodevals(2,:), 'uniformoutput', 0);
% Add labels, with a vertical offset to the y coords so that labels don't sit on nodes
text(x(nodeidx), y(nodeidx) - 0.03, labels);
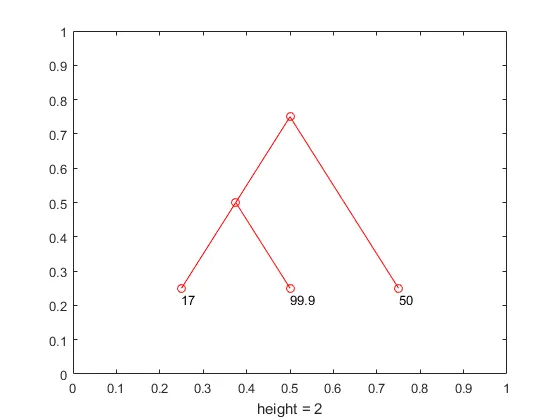
下面是单元格myCellArray = {{17, 99.9}, 50}的示例输出,我选择这些数字是为了明确它们不是实际的“节点编号”!