JavaFX 2.x:Y轴上的对数刻度

4

根据这篇非常好的帖子(Java FX 2中的对数刻度),我已经修改了这个类以在Y轴上获得对数刻度,它运行良好。我唯一的问题是水平网格线很少,而且刻度总是从0或接近零开始范围。

这是我得到的结果

enter image description here

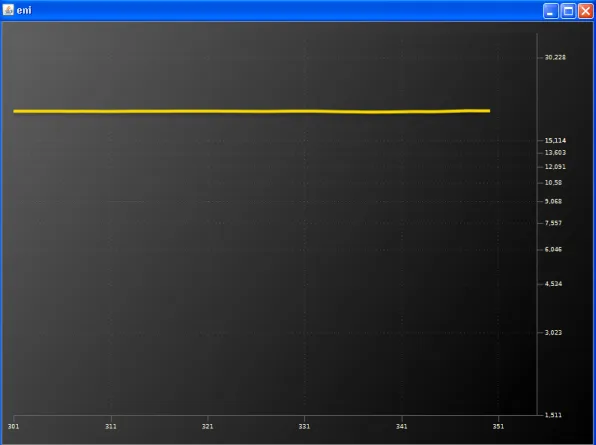
我希望我的数据系列的最小和最大范围也有刻度值网格,在这种情况下,最小值=19.35,最大值=20.35;目前所有10条水平网格线都绘制在此范围之外。

如何实现这一点?

感谢大家,这是我用于Y轴的对数代码:

import java.text.NumberFormat;
import java.util.ArrayList;
import java.util.List;
import javafx.beans.binding.DoubleBinding;
import javafx.beans.property.DoubleProperty;
import javafx.beans.property.SimpleDoubleProperty;
import javafx.scene.chart.ValueAxis;

//http://blog.dooapp.com/logarithmic-scale-strikes-back-in-javafx-20        
public class LogarithmicAxis extends ValueAxis<Number> {

//Create our LogarithmicAxis class that extends ValueAxis<Number> and define two properties that will represent the log lower and upper bounds of our axis.     
private final DoubleProperty logUpperBound = new SimpleDoubleProperty();
private final DoubleProperty logLowerBound = new SimpleDoubleProperty();
//

//we bind our properties with the default bounds of the value axis. But before, we should verify the given range according to the mathematic logarithmic interval definition.
public LogarithmicAxis() {
    super(1, 100);
    bindLogBoundsToDefaultBounds();
}

public LogarithmicAxis(double lowerBound, double upperBound) {
    super(lowerBound, upperBound);
try {
    validateBounds(lowerBound, upperBound);
    bindLogBoundsToDefaultBounds();
} catch (IllegalLogarithmicRangeException e) {
    }
}

/**
 * Bind our logarithmic bounds with the super class bounds, consider the base 10 logarithmic scale.
 */
private void bindLogBoundsToDefaultBounds() {
    logLowerBound.bind(new DoubleBinding() {
        {
            super.bind(lowerBoundProperty());
        }

        @Override
        protected double computeValue() {
            return Math.log10(lowerBoundProperty().get());
        }
    });
    logUpperBound.bind(new DoubleBinding() {
        {
            super.bind(upperBoundProperty());
        }

        @Override
        protected double computeValue() {
            return Math.log10(upperBoundProperty().get());
        }
    });
}

/**
 * Validate the bounds by throwing an exception if the values are not conform to the mathematics log interval:
 * ]0,Double.MAX_VALUE]
 *
 * @param lowerBound
 * @param upperBound
 * @throws IllegalLogarithmicRangeException
 */
private void validateBounds(double lowerBound, double upperBound) throws IllegalLogarithmicRangeException {
    if (lowerBound < 0 || upperBound < 0 || lowerBound > upperBound) {
        throw new IllegalLogarithmicRangeException(
                "The logarithmic range should be include to ]0,Double.MAX_VALUE] and the lowerBound should be less than the upperBound");
    }
}

//Now we have to implement all abstract methods of the ValueAxis class.
//The first one, calculateMinorTickMarks is used to get the list of minor tick marks position that you want to display on the axis. You could find my definition below. It's based on the number of minor tick and the logarithmic formula.
@Override
protected List<Number> calculateMinorTickMarks() {
    Number[] range = getRange();
    List<Number> minorTickMarksPositions = new ArrayList<>();
    if (range != null) {

        Number lowerBound = range[0];
        Number upperBound = range[1];
        double logUpperBound = Math.log10(upperBound.doubleValue());
        double logLowerBound = Math.log10(lowerBound.doubleValue());

        int minorTickMarkCount = getMinorTickCount();

        for (double i = logLowerBound; i <= logUpperBound; i += 1) {
            for (double j = 0; j <= 10; j += (1. / minorTickMarkCount)) {
                double value = j * Math.pow(10, i);
                minorTickMarksPositions.add(value);
            }
        }
    }
    return minorTickMarksPositions;
}

//Then, the calculateTickValues method is used to calculate a list of all the data values for each tick mark in range, represented by the second parameter. The formula is the same than previously but here we want to display one tick each power of 10.
@Override
protected List<Number> calculateTickValues(double length, Object range) {
    List<Number> tickPositions = new ArrayList<Number>();
    if (range != null) {
        Number lowerBound = ((Number[]) range)[0];
        Number upperBound = ((Number[]) range)[1];
        double logLowerBound = Math.log10(lowerBound.doubleValue());
        double logUpperBound = Math.log10(upperBound.doubleValue());
        System.out.println("lower bound is: " + lowerBound.doubleValue());

        for (double i = logLowerBound; i <= logUpperBound; i += 1) {
            for (double j = 1; j <= 10; j++) {
                double value = (j * Math.pow(10, i));
                tickPositions.add(value);
            }
        }
    }
    return tickPositions;
}

//The getRange provides the current range of the axis. A basic implementation is to return an array of the lowerBound and upperBound properties defined into the ValueAxis class.
@Override
protected Number[] getRange() {
    return new Number[] { lowerBoundProperty().get(), upperBoundProperty().get() };
}

//The getTickMarkLabel is only used to convert the number value to a string that will be displayed under the tickMark. Here I choose to use a number formatter.
@Override
protected String getTickMarkLabel(Number value) {
    NumberFormat formatter = NumberFormat.getInstance();
    formatter.setMaximumIntegerDigits(6);
    formatter.setMinimumIntegerDigits(1);
    return formatter.format(value);
}

//The method setRange is used to update the range when data are added into the chart. There is two possibilities, the axis is animated or not. The simplest case is to set the lower and upper bound properties directly with the new values.
@Override    
protected void setRange(Object range, boolean animate) {
    if (range != null) {
        Number lowerBound = ((Number[]) range)[0];
        Number upperBound = ((Number[]) range)[1];
        try {
            validateBounds(lowerBound.doubleValue(), upperBound.doubleValue());
        } catch (IllegalLogarithmicRangeException e) {
        }

        lowerBoundProperty().set(lowerBound.doubleValue());
        upperBoundProperty().set(upperBound.doubleValue());
    }
}

//We are almost done but we forgot to override 2 important methods that are used to perform the matching between data and the axis (and the reverse).
@Override
public Number getValueForDisplay(double displayPosition) {
    double delta = logUpperBound.get() - logLowerBound.get();
    if (getSide().isVertical()) {
        return Math.pow(10, (((displayPosition - getHeight()) / -getHeight()) * delta) + logLowerBound.get());
    } else {
        return Math.pow(10, (((displayPosition / getWidth()) * delta) + logLowerBound.get()));
    }
}

@Override
public double getDisplayPosition(Number value) {
    double delta = logUpperBound.get() - logLowerBound.get();
    double deltaV = Math.log10(value.doubleValue()) - logLowerBound.get();
    if (getSide().isVertical()) {
        return (1. - ((deltaV) / delta)) * getHeight();
    } else {
        return ((deltaV) / delta) * getWidth();
    }
}

/**
 * Exception to be thrown when a bound value isn't supported by the logarithmic axis<br>
 *
 *
 * @author Kevin Senechal mailto: kevin.senechal@dooapp.com
 *
 */
public class IllegalLogarithmicRangeException extends Exception {
/**
 * @param string
 */
    public IllegalLogarithmicRangeException(String message) {
        super(message);
    }
}
}
2个回答

4

我们也曾遇到过对数轴的建议实现存在的问题,以下是完整的代码以及我们所采用的修复方法。

import com.sun.javafx.charts.ChartLayoutAnimator;
import java.text.NumberFormat;
import java.util.ArrayList;
import java.util.LinkedList;
import java.util.List;
import javafx.animation.KeyFrame;
import javafx.animation.KeyValue;
import javafx.beans.binding.DoubleBinding;
import javafx.beans.property.DoubleProperty;
import javafx.beans.property.SimpleDoubleProperty;
import javafx.scene.chart.ValueAxis;
import javafx.util.Duration;

//http://blog.dooapp.com/logarithmic-scale-strikes-back-in-javafx-20
//Edited by Vadim Levit & Benny Lutati for usage in AgentZero ( https://code.google.com/p/azapi-test/ )
public class LogarithmicNumberAxis extends ValueAxis<Number> {

    private Object currentAnimationID;
    private final ChartLayoutAnimator animator = new ChartLayoutAnimator(this);

//Create our LogarithmicAxis class that extends ValueAxis<Number> and define two properties that will represent the log lower and upper bounds of our axis.     
    private final DoubleProperty logUpperBound = new SimpleDoubleProperty();
    private final DoubleProperty logLowerBound = new SimpleDoubleProperty();
//

//we bind our properties with the default bounds of the value axis. But before, we should verify the given range according to the mathematic logarithmic interval definition.
    public LogarithmicNumberAxis() {
        super(1, 10000000);
        bindLogBoundsToDefaultBounds();
    }

    public LogarithmicNumberAxis(double lowerBound, double upperBound) {
        super(lowerBound, upperBound);
        validateBounds(lowerBound, upperBound);
        bindLogBoundsToDefaultBounds();
    }

    public void setLogarithmizedUpperBound(double d) {
        double nd = Math.pow(10, Math.ceil(Math.log10(d)));
        setUpperBound(nd == d ? nd * 10 : nd);
    }

    /**
     * Bind our logarithmic bounds with the super class bounds, consider the
     * base 10 logarithmic scale.
     */
    private void bindLogBoundsToDefaultBounds() {
        logLowerBound.bind(new DoubleBinding() {
            {
                super.bind(lowerBoundProperty());
            }

            @Override
            protected double computeValue() {
                return Math.log10(lowerBoundProperty().get());
            }
        });
        logUpperBound.bind(new DoubleBinding() {
            {
                super.bind(upperBoundProperty());
            }

            @Override
            protected double computeValue() {
                return Math.log10(upperBoundProperty().get());
            }
        });
    }

    /**
     * Validate the bounds by throwing an exception if the values are not
     * conform to the mathematics log interval: ]0,Double.MAX_VALUE]
     *
     * @param lowerBound
     * @param upperBound
     * @throws IllegalLogarithmicRangeException
     */
    private void validateBounds(double lowerBound, double upperBound) throws IllegalLogarithmicRangeException {
        if (lowerBound < 0 || upperBound < 0 || lowerBound > upperBound) {
            throw new IllegalLogarithmicRangeException(
                    "The logarithmic range should be in [0,Double.MAX_VALUE] and the lowerBound should be less than the upperBound");
        }
    }

//Now we have to implement all abstract methods of the ValueAxis class.
//The first one, calculateMinorTickMarks is used to get the list of minor tick marks position that you want to display on the axis. You could find my definition below. It's based on the number of minor tick and the logarithmic formula.
    @Override
    protected List<Number> calculateMinorTickMarks() {
        List<Number> minorTickMarksPositions = new ArrayList<>();
        return minorTickMarksPositions;
    }

//Then, the calculateTickValues method is used to calculate a list of all the data values for each tick mark in range, represented by the second parameter. The formula is the same than previously but here we want to display one tick each power of 10.
    @Override
    protected List<Number> calculateTickValues(double length, Object range) {
        LinkedList<Number> tickPositions = new LinkedList<>();
        if (range != null) {
            double lowerBound = ((double[]) range)[0];
            double upperBound = ((double[]) range)[1];

            for (double i = Math.log10(lowerBound); i <= Math.log10(upperBound); i++) {
                tickPositions.add(Math.pow(10, i));
            }

            if (!tickPositions.isEmpty()) {
                if (tickPositions.getLast().doubleValue() != upperBound) {
                    tickPositions.add(upperBound);
                }
            }
        }

        return tickPositions;
    }

    /**
     * The getRange provides the current range of the axis. A basic
     * implementation is to return an array of the lowerBound and upperBound
     * properties defined into the ValueAxis class.
     *
     * @return
     */
    @Override
    protected double[] getRange() {
        return new double[]{
            getLowerBound(),
            getUpperBound()
        };
    }

    /**
     * The getTickMarkLabel is only used to convert the number value to a string
     * that will be displayed under the tickMark. Here I choose to use a number
     * formatter.
     *
     * @param value
     * @return
     */
    @Override
    protected String getTickMarkLabel(Number value) {
        NumberFormat formatter = NumberFormat.getInstance();
        formatter.setMaximumIntegerDigits(10);
        formatter.setMinimumIntegerDigits(1);
        return formatter.format(value);
    }

    /**
     * The method setRange is used to update the range when data are added into
     * the chart. There is two possibilities, the axis is animated or not. The
     * simplest case is to set the lower and upper bound properties directly
     * with the new values.
     *
     * @param range
     * @param animate
     */
    @Override
    protected void setRange(Object range, boolean animate) {
        if (range != null) {
            final double[] rangeProps = (double[]) range;
            final double lowerBound = rangeProps[0];
            final double upperBound = rangeProps[1];

            final double oldLowerBound = getLowerBound();
            setLowerBound(lowerBound);
            setUpperBound(upperBound);
            if (animate) {
                animator.stop(currentAnimationID);
                currentAnimationID = animator.animate(
                        new KeyFrame(Duration.ZERO,
                                new KeyValue(currentLowerBound, oldLowerBound)
                        ),
                        new KeyFrame(Duration.millis(700),
                                new KeyValue(currentLowerBound, lowerBound)
                        )
                );
            } else {
                currentLowerBound.set(lowerBound);
            }
        }
    }

    /**
     * We are almost done but we forgot to override 2 important methods that are
     * used to perform the matching between data and the axis (and the reverse).
     *
     * @param displayPosition
     * @return
     */
    @Override
    public Number getValueForDisplay(double displayPosition) {
        double delta = logUpperBound.get() - logLowerBound.get();
        if (getSide().isVertical()) {
            return Math.pow(10, (((displayPosition - getHeight()) / -getHeight()) * delta) + logLowerBound.get());
        } else {
            return Math.pow(10, (((displayPosition / getWidth()) * delta) + logLowerBound.get()));
        }
    }

    @Override
    public double getDisplayPosition(Number value) {
        double delta = logUpperBound.get() - logLowerBound.get();
        double deltaV = Math.log10(value.doubleValue()) - logLowerBound.get();
        if (getSide().isVertical()) {
            return (1. - ((deltaV) / delta)) * getHeight();
        } else {
            return ((deltaV) / delta) * getWidth();
        }
    }

    /**
     * Exception to be thrown when a bound value isn't supported by the
     * logarithmic axis<br>
     *
     *
     * @author Kevin Senechal mailto: kevin.senechal@dooapp.com
     *
     */
    public class IllegalLogarithmicRangeException extends RuntimeException {

        /**
         * @param string
         */
        public IllegalLogarithmicRangeException(String message) {
            super(message);
        }
    }
}

我添加了这个类,但使用它会导致应用程序无法显示。 - WestCoastProjects

2

我认为你的问题在于:

    super(1, 100);

根据文档

使用给定的上下限创建一个非自动范围的ValueAxis

尝试使用没有参数的构造函数,这将使边界自动调整。

您应该最终得到一个像这样的构造函数:

public LogarithmicAxis() {
    // was: super(1, 100);
    super();
    bindLogBoundsToDefaultBounds();
}

谢谢您的回复,我仍然没有绘制任何水平线网格,我需要在哪里修改代码? - Alberto acepsut

网页内容由stack overflow 提供, 点击上面的
可以查看英文原文,
原文链接