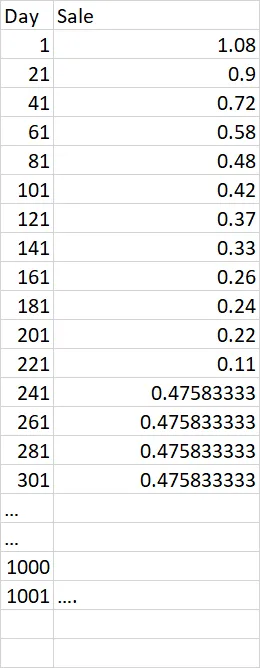
使用pandas计算简单的历史平均值

3

我有一个如下所示的数据帧

data = pd.DataFrame({'day':['1','21','41','61','81','101','121','141','161','181','201','221'],'Sale':[1.08,0.9,0.72,0.58,0.48,0.42,0.37,0.33,0.26,0.24,0.22,0.11]})

我希望通过计算直到day 221的所有记录的平均值来填充day 241的值。同样地,我想通过计算直到day 241的所有记录的平均值来计算day 261的值,以此类推。
例如:通过从day 1到day n-21的所有值的平均值来计算day n的值。
我想做到day 1001
我尝试了以下内容,但不正确。
df['day'] = df.iloc[:,1].rolling(window=all).mean()

如何在“day”列下为每天创建新行?
我期望输出结果如下所示。

enter image description here

1个回答

6

听起来你正在寻找扩展平均值:

import numpy as np
import pandas as pd

df = pd.DataFrame({'day': ['1', '21', '41', '61', '81', '101', '121', '141',
                           '161', '181', '201', '221'],
                   'Sale': [1.08, 0.9, 0.72, 0.58, 0.48, 0.42, 0.37, 0.33, 0.26,
                            0.24, 0.22, 0.11]})

# Generate Some new values
to_add = pd.DataFrame({'day': np.arange(241, 301, 20)})

# Add New Values To End of DataFrame
new_df = pd.concat((df, to_add)).reset_index(drop=True)

# Replace Values Where Sale is NaN with the expanding mean
new_df['Sale'] = np.where(new_df['Sale'].isna(),
                          new_df['Sale'].expanding().mean(),
                          new_df['Sale'])
print(new_df)

    day      Sale
0     1  1.080000
1    21  0.900000
2    41  0.720000
3    61  0.580000
4    81  0.480000
5   101  0.420000
6   121  0.370000
7   141  0.330000
8   161  0.260000
9   181  0.240000
10  201  0.220000
11  221  0.110000
12  241  0.475833
13  261  0.475833
14  281  0.475833

将 NaN 替换为1,然后取平均值:

import numpy as np
import pandas as pd

df = pd.DataFrame({'day': ['1', '21', '41', '61', '81', '101', '121', '141',
                           '161', '181', '201', '221'],
                   'Sale': [1.08, 0.9, 0.72, 0.58, 0.48, 0.42, 0.37, 0.33, 0.26,
                            0.24, 0.22, 0.11 ]})

# Generate Some new values
to_add = pd.DataFrame({'day': np.arange(241, 301, 20)})

# Add New Values To End of DataFrame
new_df = pd.concat((df, to_add)).reset_index(drop=True)
# Replace Values Where Sale is NaN with the expanding mean
new_df['Sale'] = np.where(new_df['Sale'].isna(),
                          new_df['Sale'].fillna(1).shift().expanding().mean(),
                          new_df['Sale'])
print(new_df)

    day      Sale
0     1  1.080000
1    21  0.900000
2    41  0.720000
3    61  0.580000
4    81  0.480000
5   101  0.420000
6   121  0.370000
7   141  0.330000
8   161  0.260000
9   181  0.240000
10  201  0.220000
11  221  0.110000
12  241  0.475833
13  261  0.516154
14  281  0.550714

为什么计算结果不正确?例如:输出的第13行,应该不是0.5154吗? - The Great
当我们计算第281天的值时,我希望考虑从过去(从第1天到第261天)的所有值计算出它的值。同样地,当我们进行第301天的计算时,我希望考虑从第1天到第281天的所有值,其中第281天是最近计算出的值。 - The Great
谢谢,我会尝试。尽管如此,我已经接受了答案。但是有一个问题,我们的第二种方法在现实世界中不是很常见吗?也就是说,我们添加一个新记录(带有值),我们期望看到后续值的轻微变化...那么,用1替换“NA”是正常的方法吗?我真的不明白什么时候不应该用1替换“NA”? - The Great
完全透明化:我不知道,可能有更好的方法。但是一旦到达数据的末尾,扩展平均值将不再改变。您可以自己尝试,无论您多少次将累积平均值添加到系列的末尾,并通过新长度除以该值,该值都不会改变。在这种情况下,fillna用于为每行赋予新含义,但这是一种人为注入。您可以轻松地填充0来模拟下降趋势。 - Henry Ecker

网页内容由stack overflow 提供, 点击上面的
可以查看英文原文,
原文链接