我在matplotlib中有多个子图(轴)的绘图,并且希望在轴内注释点。然而,后续的轴会覆盖之前轴上的注释(例如,在subplot(4,4,1)上的注释会被subplot(4,4,2)下面的注释覆盖)。我已经将注释zorder设置得很高,但是无济于事:/。
我使用了Joe Kington的修改版DataCursor来进行注释。
非常感谢任何帮助。
这里有一个例子: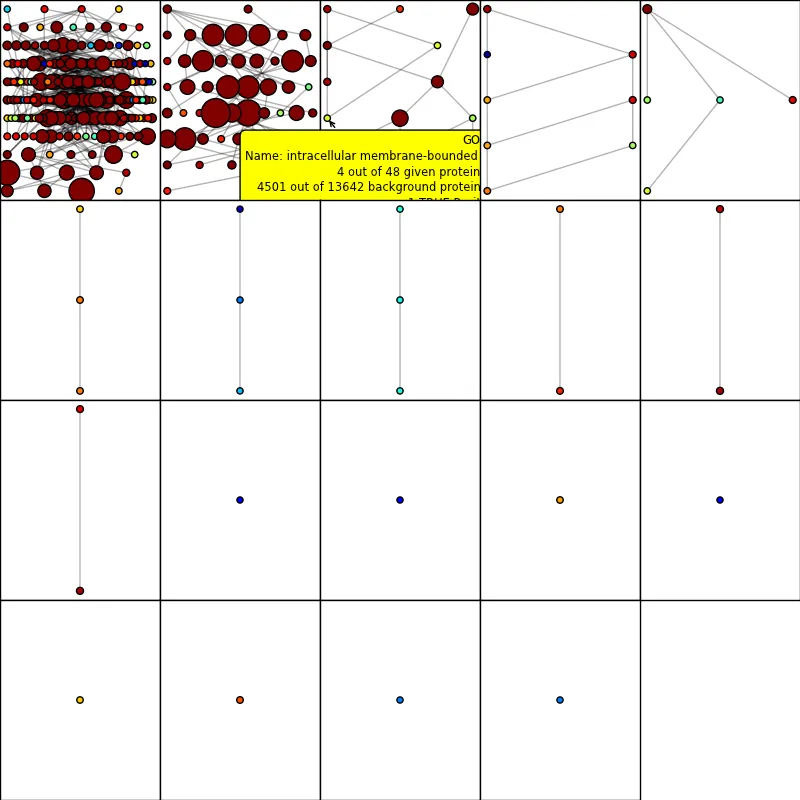
我使用了Joe Kington的修改版DataCursor来进行注释。
非常感谢任何帮助。
这里有一个例子:
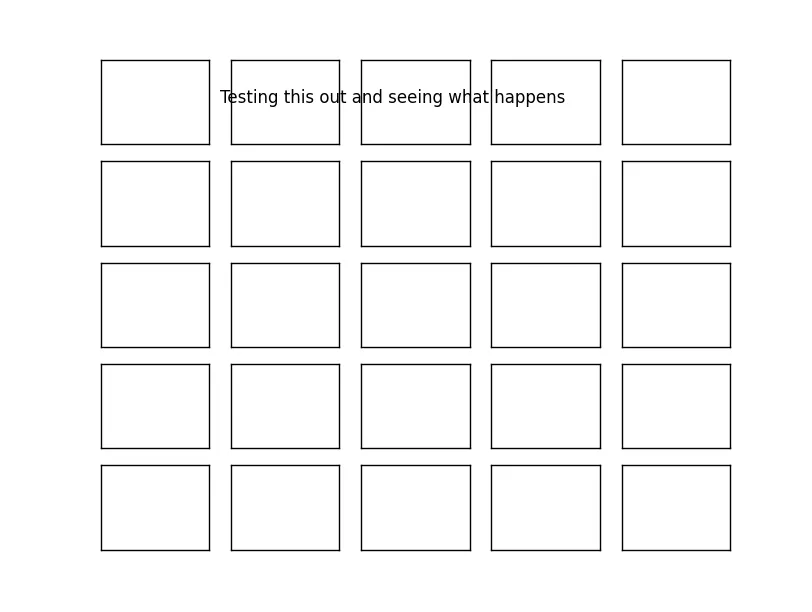
一种方法是将annotate创建的文本弹出轴并添加到图形中。这样它就会显示在所有子图的顶部。
以下是您遇到问题的快速示例:
import matplotlib.pyplot as plt

fig, axes = plt.subplots(nrows=5, ncols=5)
plt.setp(axes.flat, xticks=[], yticks=[], zorder=0)

ax = axes[0,0]
ax.annotate('Testing this out and seeing what happens', xy=(0.5, 0.5),
            xytext=(1.1, .5), textcoords='axes fraction', zorder=100)

plt.show()
如果我们将文本对象从轴中弹出并添加到图形中,它将位于顶部:
import matplotlib.pyplot as plt

fig, axes = plt.subplots(nrows=5, ncols=5)
plt.setp(axes.flat, xticks=[], yticks=[], zorder=0)

ax = axes[0,0]
ax.annotate('Testing this out and seeing what happens', xy=(0.5, 0.5),
            xytext=(1.1, .5), textcoords='axes fraction', zorder=100)

fig.texts.append(ax.texts.pop())

plt.show()
您提到了 DataCursor 片段,在那里,您需要更改 annotate 方法:
def annotate(self, ax):
    """Draws and hides the annotation box for the given axis "ax"."""
    annotation = ax.annotate(self.template, xy=(0, 0), ha='right',
            xytext=self.offsets, textcoords='offset points', va='bottom',
            bbox=dict(boxstyle='round,pad=0.5', fc='yellow', alpha=0.5),
            arrowprops=dict(arrowstyle='->', connectionstyle='arc3,rad=0')
            )
    # Put the annotation in the figure instead of the axes so that it will be on
    # top of other subplots.
    ax.figure.texts.append(ax.texts.pop())

    annotation.set_visible(False)
    return annotation
我没有测试最后一部分,但它应该可以工作...
zorder,而不是将文本从图表本身中取出(顺便说一下,这对我来说并没有起作用)。import matplotlib.pyplot as plt
fig, axes = plt.subplots(nrows=5, ncols=3)
num_plots = len(axes) * len(axes[0])
for row in axes:
for column in row:
column.zorder = num_plots
num_plots -= 1
图中从左到右、从上到下的每个后续图形都会“位于”前一个图形之后,因此注释不会重叠。
fig.text),它将始终显示在上方。只要它在轴内,它就会被其他子图覆盖,因为zorder仅适用于轴内部。我可以想到一些恶劣的方法将所有的annotate调用替换为fig.text,但这并不美观... 应该有更好的方法... - Joe Kington