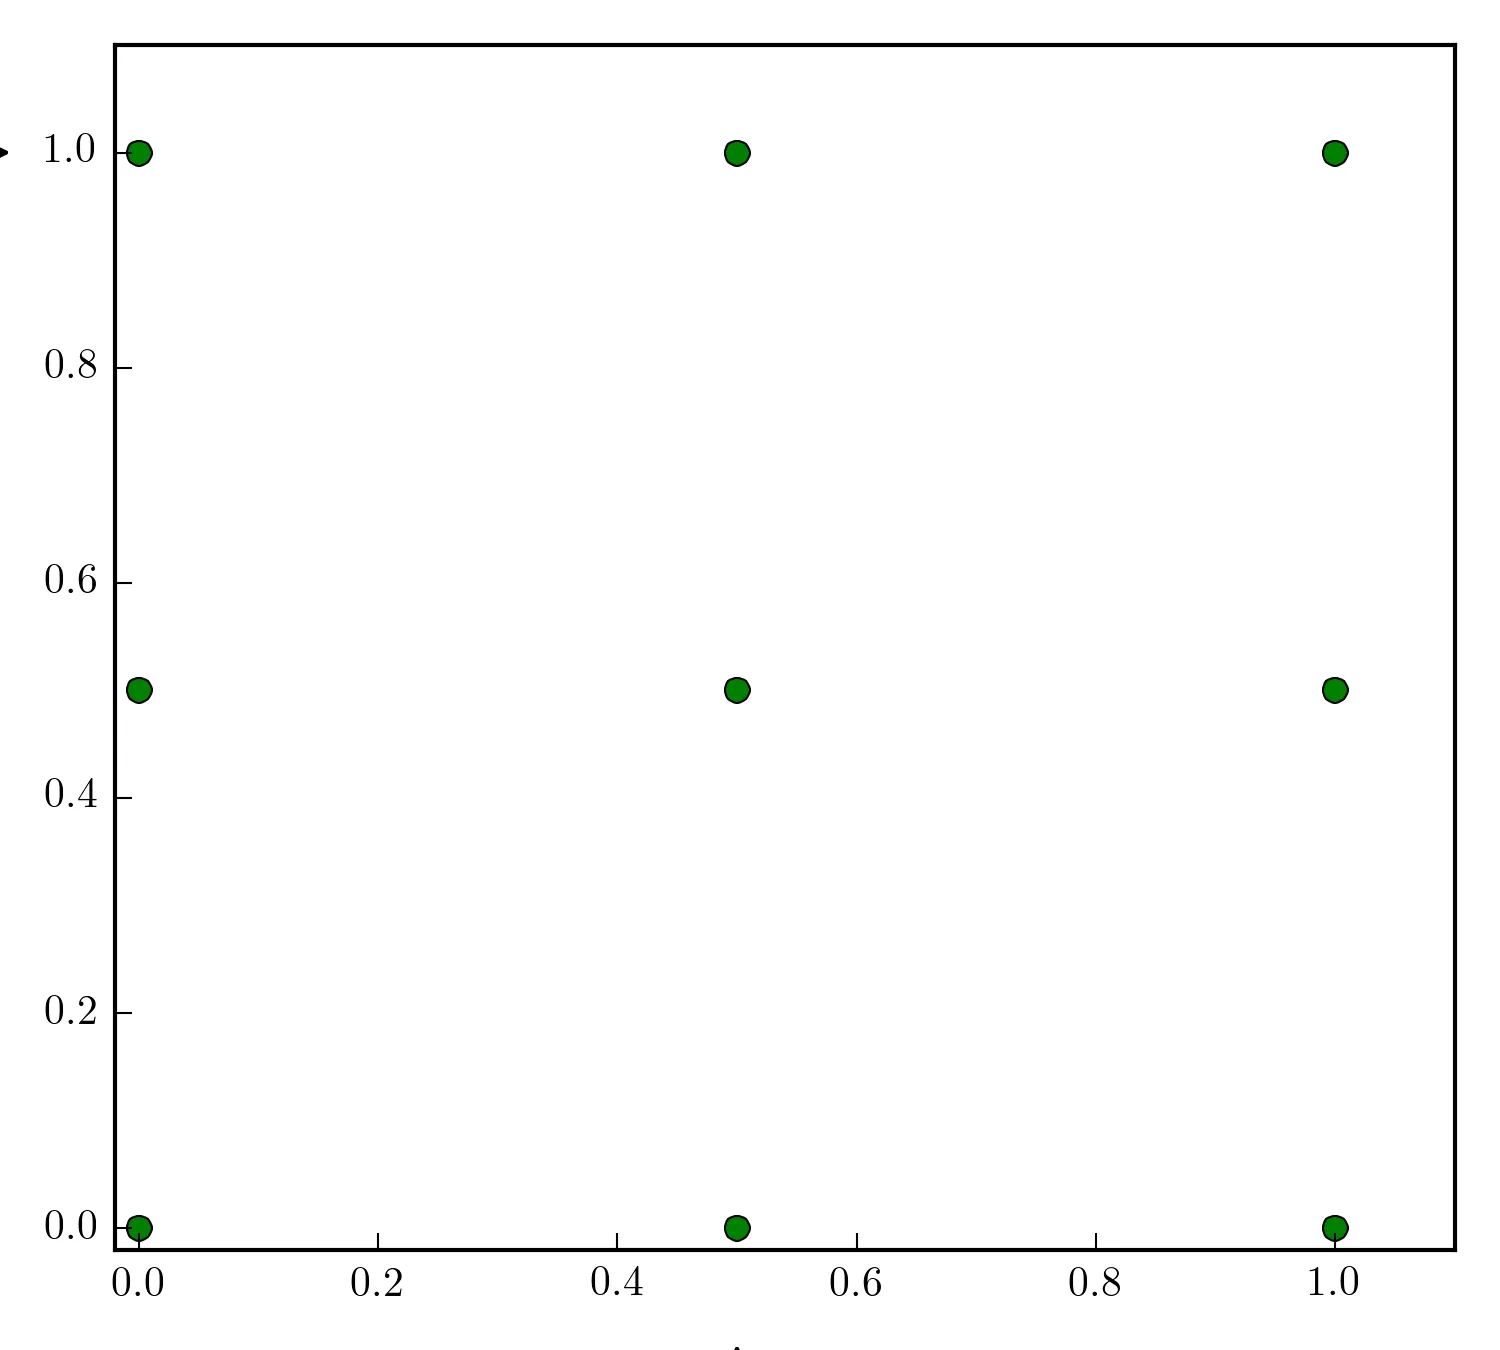
我在使用matplotlib绘制带注释的图形时遇到了问题。我发现注释(位于绘图区域之外)在保存的图片中被裁剪了,如下图所示:
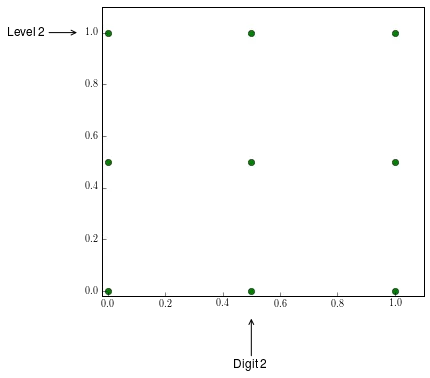
我想得到以下所示的图像:
有人知道如何解决这个问题吗?我注意到有人建议使用plt.tight_plot()或在rcParams中使用fig.autolayout,但似乎都不起作用。下面是生成该图的代码:
fig, ax = plt.subplots()
ax.set_xlim([-0.02,1.1])
ax.set_ylim([-0.02,1.1])

ax.plot([0,0,0,0.5,0.5,0.5,1,1,1], [0,0.5,1,0,0.5,1,0,0.5,1], 'go')

ax.annotate("Digit 2",
            xy=(0.5, -0.1), xycoords='data',
            xytext=(0.5, -0.3), textcoords='data',
            arrowprops=dict(arrowstyle="->",
                            connectionstyle="arc3"),
             annotation_clip=False,
             fontsize = 12,
             ha='center',
            )

ax.annotate("Level 2",
            xy=(-0.1, 1), xycoords='data',
            xytext=(-0.35, 1), textcoords='data',
            arrowprops=dict(arrowstyle="->",
                            connectionstyle="arc3"),
                    annotation_clip=False,
                    fontsize = 12,
                    va='center',
            )

plt.savefig('sample.png', dpi = 300)