在Matplotlib图形中使用LaTeX渲染文本时,如何使标题居中显示?

6
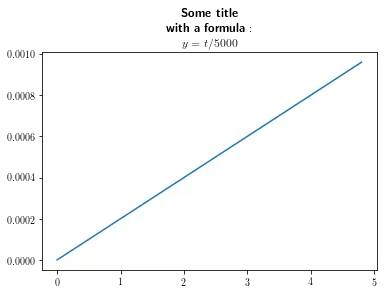
我想让一个Matplotlib图形的标题居中,其中包含一个换行(\),以LaTeX样式呈现时。在标题中插入简单的LaTeX换行代码“\\”可以生效,但是新行不会居中,使得新行从第一行笨拙地移动。
from matplotlib import pyplot as plt
plt.rc('text', usetex=True)
plt.title(r"\center{\textbf{Some title \\ with with a newline}}")

或者
plt.title(r"\begin{centering}{\textbf{Some title \\ with a newline}\end{centering}")

无法工作

当我输入先前引用的行时,在图表上根本没有标题输出。但是在Python命令解释器中并没有LaTeX错误。


那么这个代码:
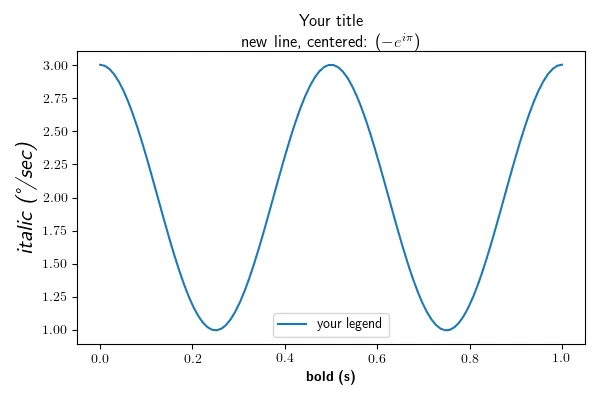
plt.title(r"$\textbf{一些标题}\\ \textbf{换行}$") 怎么样? - sentence
这个似乎对于如此短的标题可以工作。 然而,我的真实标题包含一个数学模式符号,并且更长。 即使我去掉数学模式符号以避免破坏数学公式,较长的标题似乎也不能居中...plt.title(r"$\textbf{使用不同沉积金属的腔内强度增益因子 (}\mathcal{A}\textbf{)}$") - elkevn
plt.title(r"$\textbf{不同沉积金属下腔内强度的增益因子(A)}$" "\n" r"$\textbf{是否有用?}$") 有用吗? - sentence
2个回答

4

您可以轻松地在plt.title()中使用\n来获得换行:

import numpy as np
import matplotlib.pyplot as plt

plt.rc('text', usetex=True)

t = np.arange(0., 5., 0.2)

plt.plot(t, t/5000,)
plt.title(r"$\textbf{Some title}$"
          "\n"
          r"$\textbf{with a formula}:$"
          "\n"
          r"$y=t/5000$")
plt.show()

enter image description here


1
太好了,这是解决我的问题的好方法!谢谢! - elkevn

1
假设您的系统已经安装了适当的LaTex,并设置好了在matplotlib内使用LaTex,您需要设置一个特定的LaTex前言,其中包含/begin{center} ... /end{center}
以下是一个工作示例。
import numpy as np
import matplotlib
matplotlib.rcParams['text.usetex'] = True
import matplotlib.pyplot as plt

custom_preamble = {                                                                          
    "text.latex.preamble":                                                                   
        r"\usepackage{amsmath}" # for the align, center,... environment
        ,
    }   
plt.rcParams.update(custom_preamble)                                                         
plt.figure(figsize= (6,4),tight_layout = True)                                               

t = np.linspace(0.0, 1.0, 100)
s = np.cos(4 * np.pi * t) + 2
plt.plot(t, s,label='your legend')

plt.xlabel(r'\textbf{bold (s)}')                                                        
plt.ylabel('\\textit{italic (\N{DEGREE SIGN}/sec)}', fontsize=16)                   
plt.title(r'\begin{center}Your title\\ new line, centered: ($-e^{i\pi}$, centered\end{center}')                  
plt.legend()
plt.show()

This gives:

enter image description here


网页内容由stack overflow 提供, 点击上面的
可以查看英文原文,
原文链接