我正在尝试使用Python渲染Latex文本。这是我的尝试:
import matplotlib.pyplot as plt

txte = r"""
The \emph{characteristic polynomial} $\chi(\lambda)$ of the
$3 \times 3$~matrix
\[ \left( \begin{array}{ccc}
a & b & c \\
d & e & f \\
g & h & i \end{array} \right)\]
is given by the formula
\[ \chi(\lambda) = \left| \begin{array}{ccc}
\lambda - a & -b & -c \\
-d & \lambda - e & -f \\
-g & -h & \lambda - i \end{array} \right|.\]
"""
plt.text(0.0,0.0, txte,fontsize=10)
fig = plt.gca()
fig.axes.get_xaxis().set_visible(False)
fig.axes.get_yaxis().set_visible(False)
plt.draw() #or savefig
plt.show()
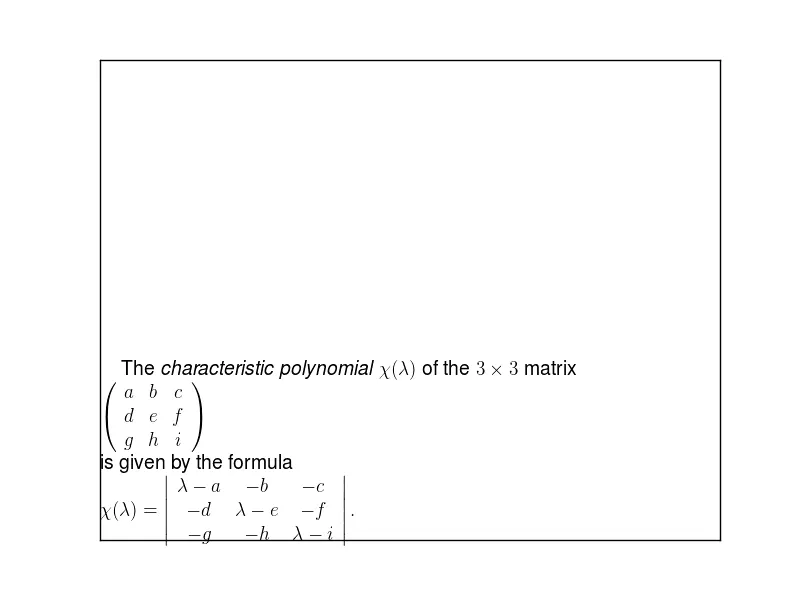
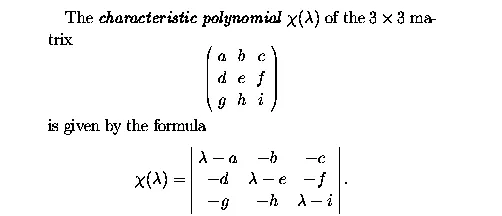
当正确渲染时,应该输出:
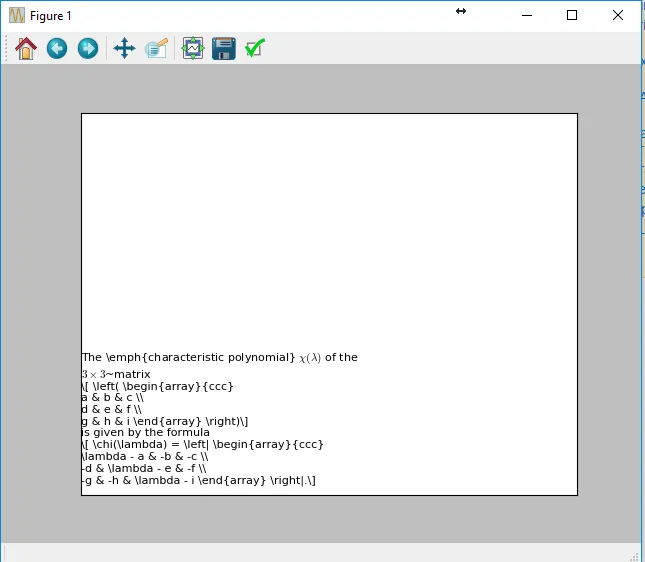
 然而,我得到的是:
 有什么想法吗?
谢谢!