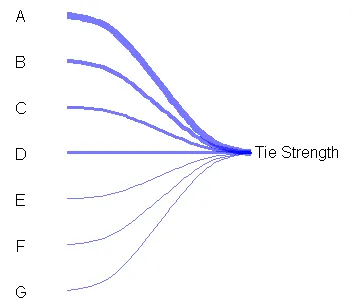
以下是一个使用基本图形功能(在网格图形中也有xspline函数,如果您想使用这些函数,但我不知道如何将它们与ggplot2结合使用,不过使用lattice可能不会太难)来开始制作左侧图形的示例:
plot.new()
par(mar=c(0,0,0,0)+.1)
plot.window(xlim=c(0,3), ylim=c(0,8))
xspline( c(1,1.25,1.75,2), c(7,7,4,4), s=1, lwd=32.8/4.5, border="#0000ff88", lend=1)
xspline( c(1,1.25,1.75,2), c(6,6,4,4), s=1, lwd=19.7/4.5, border="#0000ff88", lend=1 )
xspline( c(1,1.25,1.75,2), c(5,5,4,4), s=1, lwd=16.5/4.5, border="#0000ff88", lend=1 )
xspline( c(1,1.25,1.75,2), c(4,4,4,4), s=1, lwd=13.8/4.5, border="#0000ff88", lend=1 )
xspline( c(1,1.25,1.75,2), c(3,3,4,4), s=1, lwd= 7.9/4.5, border="#0000ff88", lend=1 )
xspline( c(1,1.25,1.75,2), c(2,2,4,4), s=1, lwd= 4.8/4.5, border="#0000ff88", lend=1 )
xspline( c(1,1.25,1.75,2), c(1,1,4,4), s=1, lwd= 4.5/4.5, border="#0000ff88", lend=1 )

text( rep(0.75, 7), 7:1, LETTERS[1:7] )
text( 2.25, 4, 'Tie strength')
以下是使用一种略有不同的方法为右侧图形编写的初始代码:
plot.new()
par(mar=rep(0.1,4))
plot.window(xlim=c(0,7), ylim=c(-1,7))
text( 3+0.05, 0:6, 0:6, adj=0 )
text( 4-0.05, 0:6, 0:6, adj=1 )
lines( c(3,3),c(0-strheight("0"), 6+strheight("6")) )
lines( c(4,4),c(0-strheight("0"), 6+strheight("6")) )

xspline( c(3,1,3), c(0,3,6), s= -1, lwd=1, border="#00ff0055", lend=1 )
xspline( c(3,1.25,3), c(0,2.5,5), s= -1, lwd=4, border="#00ff0055", lend=1 )
xspline( c(4,4.5,4), c(5,5.5,6), s= -1, lwd=5, border="#ff000055", lend=1 )
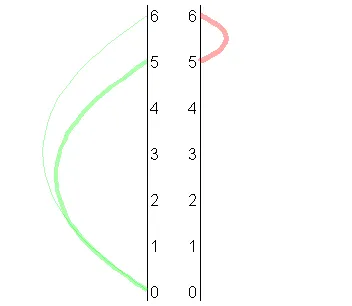
您可以修改控制点、颜色等来更接近您想要的效果。其中的许多部分可以打包成一个函数,以自动化一些操作。