4个回答
36
好的,我按照@agstudy的建议使用grid包做了一个基于图形的绘制。但还有几个问题:
- 贝塞尔箭头没有沿着线条指向,而是直接指向方框,没有呈现正确的角度。
- 我不知道如何优雅地分级贝塞尔曲线,在R中似乎很少支持渐变(大多数解决方案都是关于多条线)。
已修复
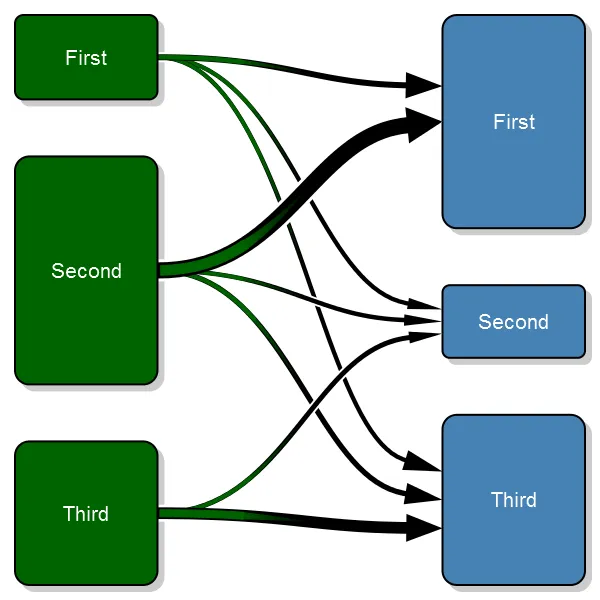
好的,经过很多工作,我终于把它准确地搞定了。我的软件包的新版本0.5.3.0已包含了该图形的代码。
旧代码
下面是该图形以及其代码:
代码如下:
#' A transition plot
#'
#' This plot purpose is to illustrate how states change before and
#' after. In my research I use it before surgery and after surgery
#' but it can be used in any situation where you have a change from
#' one state to another
#'
#' @param transition_flow This should be a matrix with the size of the transitions.
#'  The unit for each cell should be number of observations, row/column-proportions
#'  will show incorrect sizes. The matrix needs to be square. The best way to generate
#'  this matrix is probably just do a \code{table(starting_state, end_state)}. The rows
#'  represent the starting positions, while the columns the end positions. I.e. the first
#'  rows third column is the number of observations that go from the first class to the
#'  third class.
#' @param box_txt The text to appear inside of the boxes. If you need line breaks
#'  then you need to manually add a \\n inside the string.
#' @param tot_spacing The proportion of the vertical space that is to be left
#'  empty. It is then split evenly between the boxes.
#' @param box_width The width of the box. By default the box is one fourth of
#'  the plot width.
#' @param fill_start_box The fill color of the start boxes. This can either
#'  be a single value ore a vector if you desire different colors for each
#'  box.
#' @param txt_start_clr The text color of the start boxes. This can either
#'  be a single value ore a vector if you desire different colors for each
#'  box.
#' @param fill_end_box The fill color of the end boxes. This can either
#'  be a single value ore a vector if you desire different colors for each
#'  box.
#' @param txt_end_clr The text color of the end boxes. This can either
#'  be a single value ore a vector if you desire different colors for each
#'  box.
#' @param pt The point size of the text
#' @param min_lwd The minimum width of the line that we want to illustrate the
#'  tranisition with.
#' @param max_lwd The maximum width of the line that we want to illustrate the
#'  tranisition with.
#' @param lwd_prop_total The width of the lines may be proportional to either the
#'  other flows from that box, or they may be related to all flows. This is a boolean
#'  parameter that is set to true by default, i.e. relating to all flows.
#' @return void
#' @example examples/transitionPlot_example.R
#'
#' @author max
#' @import grid
#' @export
transitionPlot <- function (transition_flow,
                            box_txt = rownames(transition_flow),
                            tot_spacing = 0.2,
                            box_width = 1/4,
                            fill_start_box = "darkgreen",
                            txt_start_clr = "white",
                            fill_end_box = "steelblue",
                            txt_end_clr = "white",
                            pt=20,
                            min_lwd = 1,
                            max_lwd = 6,
                            lwd_prop_total = TRUE) {
  # Just for convenience
  no_boxes <- nrow(transition_flow)

  # Do some sanity checking of the variables
  if (tot_spacing < 0 ||
        tot_spacing > 1)
    stop("Total spacing, the tot_spacing param,",
      " must be a fraction between 0-1,",
      " you provided ", tot_spacing)

  if (box_width < 0 ||
        box_width > 1)
    stop("Box width, the box_width param,",
      " must be a fraction between 0-1,",
      " you provided ", box_width)

  # If the text element is a vector then that means that
  # the names are the same prior and after
  if (is.null(box_txt))
    box_txt = matrix("", ncol=2, nrow=no_boxes)
  if (is.null(dim(box_txt)) && is.vector(box_txt))
    if (length(box_txt) != no_boxes)
      stop("You have an invalid length of text description, the box_txt param,",
          " it should have the same length as the boxes, ", no_boxes, ",",
          " but you provided a length of ", length(box_txt))
    else
      box_txt <- cbind(box_txt, box_txt)
  else if (nrow(box_txt) != no_boxes ||
        ncol(box_txt) != 2)
    stop("Your box text matrix doesn't have the right dimension, ",
         no_boxes, " x 2, it has: ",
         paste(dim(box_txt), collapse=" x "))


  # Make sure that the clrs correspond to the number of boxes
  fill_start_box <- rep(fill_start_box, length.out=no_boxes)
  txt_start_clr <- rep(txt_start_clr, length.out=no_boxes)
  fill_end_box <- rep(fill_end_box, length.out=no_boxes)
  txt_end_clr <- rep(txt_end_clr, length.out=no_boxes)

  if(nrow(transition_flow) != ncol(transition_flow))
    stop("Invalid input array, the matrix is not square but ",
      nrow(transition_flow), " x ", ncol(transition_flow))

  # Set the proportion of the start/end sizes of the boxes
  prop_start_sizes <- rowSums(transition_flow)/sum(transition_flow)
  prop_end_sizes <- colSums(transition_flow)/sum(transition_flow)

  if (sum(prop_end_sizes) == 0)
    stop("You can't have all empty boxes after the transition")

  getBoxPositions <- function (no, side){
    empty_boxes <- ifelse(side == "left",
      sum(prop_start_sizes==0),
      sum(prop_end_sizes==0))

    # Calculate basics
    space <- tot_spacing/(no_boxes-1-empty_boxes)

    # Do the y-axis
    ret <- list(height=(1-tot_spacing)*ifelse(side == "left",
                                              prop_start_sizes[no],
                                              prop_end_sizes[no]))
    if (no == 1){
      ret$top <- 1
    }else{
      ret$top <- 1 -
        ifelse(side == "left",
               sum(prop_start_sizes[1:(no-1)]),
               sum(prop_end_sizes[1:(no-1)])) * (1-tot_spacing) -
        space*(no-1)
    }
    ret$bottom <- ret$top - ret$height
    ret$y <- mean(c(ret$top, ret$bottom))

    ret$y_exit <- rep(ret$y, times=no_boxes)
    ret$y_entry_height <- ret$height/3
    ret$y_entry <- seq(to=ret$y-ret$height/6,
                       from=ret$y+ret$height/6,
                       length.out=no_boxes)

    # Now the x-axis
    if (side == "right"){
      ret$left <- 1-box_width
      ret$right <- 1
    }else{
      ret$left <- 0
      ret$right <- box_width
    }

    txt_margin <- box_width/10
    ret$txt_height <- ret$height - txt_margin*2
    ret$txt_width <- box_width - txt_margin*2

    ret$x <- mean(c(ret$left, ret$right))

    return(ret)
  }

  plotBoxes <- function (no_boxes, width, txt,
    fill_start_clr, fill_end_clr,
    lwd=2, line_col="#000000") {

    plotBox <- function(bx, bx_txt, fill){
      grid.roundrect(y=bx$y, x=bx$x,
        height=bx$height, width=width,
        gp = gpar(lwd=lwd, fill=fill, col=line_col))

      if (bx_txt != ""){
        grid.text(bx_txt,y=bx$y, x=bx$x,
          just="centre",
          gp=gpar(col=txt_start_clr, fontsize=pt))
      }
    }

    for(i in 1:no_boxes){
      if (prop_start_sizes[i] > 0){
        bx_left <- getBoxPositions(i, "left")
        plotBox(bx=bx_left, bx_txt = txt[i, 1], fill=fill_start_clr[i])
      }

      if (prop_end_sizes[i] > 0){
        bx_right <- getBoxPositions(i, "right")
        plotBox(bx=bx_right, bx_txt = txt[i, 2], fill=fill_end_clr[i])
      }
    }
  }

  # Do the plot
  require("grid")
  plot.new()
  vp1 <- viewport(x = 0.51, y = 0.49, height=.95, width=.95)
  pushViewport(vp1)

  shadow_clr <- rep(grey(.8), length.out=no_boxes)
  plotBoxes(no_boxes,
            box_width,
            txt = matrix("", nrow=no_boxes, ncol=2), # Don't print anything in the shadow boxes
            fill_start_clr = shadow_clr,
            fill_end_clr  = shadow_clr,
            line_col=shadow_clr[1])
  popViewport()

  vp1 <- viewport(x = 0.5, y = 0.5, height=.95, width=.95)
  pushViewport(vp1)
  plotBoxes(no_boxes, box_width,
            txt = box_txt,
            fill_start_clr = fill_start_box,
            fill_end_clr  = fill_end_box)

  for (i in 1:no_boxes){
    bx_left <- getBoxPositions(i, "left")
    for (flow in 1:no_boxes){
      if (transition_flow[i,flow] > 0){
        bx_right <- getBoxPositions(flow, "right")

        a_l <- (box_width/4)
        a_angle <- atan(bx_right$y_entry_height/(no_boxes+.5)/2/a_l)*180/pi
        if (lwd_prop_total)
          lwd <- min_lwd + (max_lwd-min_lwd)*transition_flow[i,flow]/max(transition_flow)
        else
          lwd <- min_lwd + (max_lwd-min_lwd)*transition_flow[i,flow]/max(transition_flow[i,])

        # Need to adjust the end of the arrow as it otherwise overwrites part of the box
        # if it is thick
        right <- bx_right$left-.00075*lwd
        grid.bezier(x=c(bx_left$right, .5, .5, right),
                    y=c(bx_left$y_exit[flow], bx_left$y_exit[flow],
                        bx_right$y_entry[i], bx_right$y_entry[i]),
                    gp=gpar(lwd=lwd, fill="black"),
                    arrow=arrow(type="closed", angle=a_angle, length=unit(a_l, "npc")))
        # TODO: A better option is probably bezierPoints

      }
    }
  }
  popViewport()
}
这个例子是使用以下工具生成的:
# Settings
no_boxes <- 3
# Generate test setting
transition_matrix <- matrix(NA, nrow=no_boxes, ncol=no_boxes)
transition_matrix[1,] <- 200*c(.5, .25, .25)
transition_matrix[2,] <- 540*c(.75, .10, .15)
transition_matrix[3,] <- 340*c(0, .2, .80)

transitionPlot(transition_matrix,
  box_txt = c("First", "Second", "Third"))
我也已将此添加到我的Gmisc包中。享受吧!
- Max Gordon
6
@agstudy:看看这个新版本的绘图。现在它完全是我想要的样子,几乎像一个专业的图表 :-D - Max Gordon
@MaxGordon如果我有两个转移矩阵,比如从A到B,然后从B到C。我能够获得一个转移图像,就像 A >> B >> C这样吗? - darkage
@darkage:我刚在包主页的评论里回答了你的问题:http://gforge.se/packages/ - Max Gordon
@darkage:我正在尝试实现一个能够做到这一点的函数,你可以在 transitionClass 分支中找到它:develop::install_github("gforge/Gmist", "transitionClass") 我应该会在一个月或两个月内完全清理它以供 CRAN 使用 - 查看vignette以了解如何使用它。 - Max Gordon
这个包很棒,但如果它将来支持非方阵的输入数据会更好。例如从A、B、C状态到A、B、C、D、E,假设从D和E没有转换到任何其他状态。在当前实现中,我得到了“无效的输入数组,矩阵不是方阵”的错误提示。 - gkoul
你尝试过将值设置为0吗?应该允许出现类别。 - Max Gordon
7
这只是为了展示plotmat可用于此目的:
library(diagram)

M  <- matrix(nrow = 4, ncol = 4, byrow = TRUE, data = 0)
C <- M
A <- M
M[2, 1] <- "f11"
M[4, 1] <- "f12"
M[2, 3] <- "f21"
M[4, 3] <- "f22"
C[4, 1] <- -0.1
C[2, 3] <- 0.1
A[2, 1] <- A[2, 3] <- A[4, 3] <-4
A[4, 1] <-  8

col   <- M
col[] <- "red"
col[2, 1] <- col[4, 1] <- "blue"
plotmat(M, pos = c(2, 2), curve = C, name = c(1,1,2,2),
        box.size=c(0.05,0.03,0.03,0.05), box.prop = 2,
        arr.lwd=A,
        lwd = 1, box.lwd = 2, box.cex = 1, cex.txt = 0.8,
        arr.lcol = col, arr.col = col, box.type = "rect",
        lend=3)
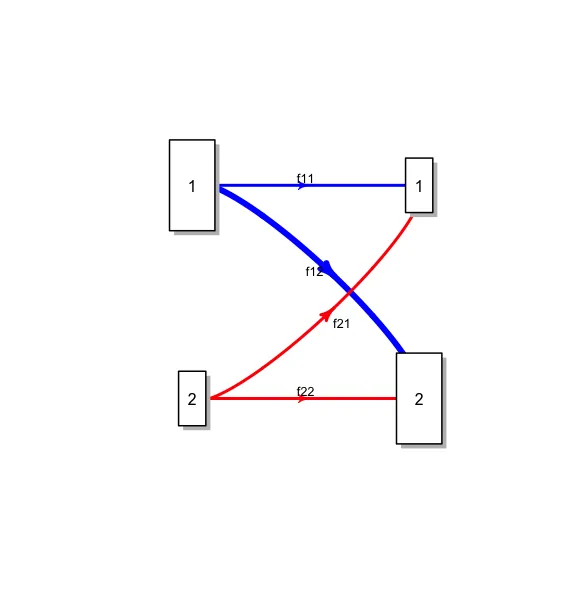
进行一些微调并可能修改功能,就能得到您想要的图形。
- Roland
3
谢谢,这实际上非常接近我想要的。除非有人在未来几天提出更接近的替代方案,否则我会将其标记为答案。我心中有一个想法,就是让盒子彼此更靠近一些...但我想这已经足够好了。 - Max Gordon
经过一些调整,我实际上已经接近我想要的地方了。有三个框会变得混乱,这是我的最终目的地,但我猜如果我想要更多的控制权,我需要自己编写曲线。我只是觉得如果使用正确的软件包,这应该是“超级简单”的,因为你可以在报纸等媒体中看到这种类型的图形。 - Max Gordon
只是想让你知道,我实现了自己的绘图版本。它仍然不完美,但足够好了。我会保留你的答案,因为你接近了我想要的。 - Max Gordon
4
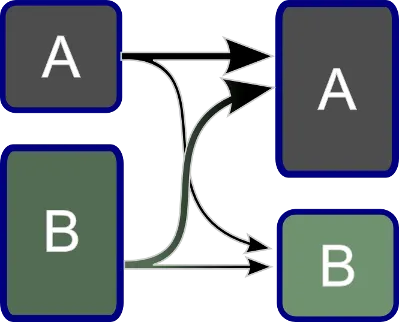
我的回答只是一个概念证明,演示使用 grid 和 bezier 制作此图的可行性。我使用 lattice 绘制场景,然后使用原生的 grid 包。这只是一个开始,我认为你可以轻松完成它。
library(grid)
library(lattice)

dat <- data.frame(x=c(1,1,2,2),
                  y=c(1,2,1,2),
                  weight=c(2,1,1,2),
                  text=c('B','A','B','A'))
cols <- colorRampPalette(c("grey", "green"))(nrow(dat))
xyplot(y~x,data=dat,groups=weight,
       xlim=extendrange(dat$x,f=1),
       ylim=extendrange(dat$y,f=1),
       panel=function(x,y,groups,...){
         lapply(seq_along(x),function(i){
         grid.roundrect(x[i],y[i],
                        width=.5,
                        height=.5*groups[i],
                        gp=gpar(fill=cols[i],lwd=5,col='blue'),
                        def='native')
         grid.text(x[i],y[i],label=dat$text[i],
                    gp=gpar(cex=5,col='white'),
                   def='native')
        })
         xx <- c(x[1]+0.25, x[1]+0.25, x[3]-0.25, x[3]-0.25)
         yy <- c(y[1], y[1], y[3], y[3])
         grid.bezier(xx, yy,
                     gp=gpar(lwd=3, fill="black"),
                     arrow=arrow(type="closed"),
                     def='native')
         xx <- c(x[1]+0.25, 1, 2, x[4]-0.25)
         yy <- c(y[1], 2, 1, y[4])
         grid.bezier(xx, yy,
                     gp=gpar(lwd=3, fill="black"),
                     arrow=arrow(type="closed",
                                 length=unit(0.5, "inches")),
                     def='native')
         xx <- c(x[2]+0.25, x[2]+0.25, x[4]-0.25, x[4]-0.25)
         yy <- c(y[2], y[2], y[4], y[4])
         grid.bezier(xx, yy,
                     gp=gpar(lwd=3, fill="black"),
                     arrow=arrow(type="closed",
                                 length=unit(0.5, "inches")),
                     def='native')

         })
- agstudy
4
谢谢!看起来这是一个很好的起点。不确定为什么您将它放在格子内,因为轴上没有必要... - Max Gordon
@MaxGordon 我知道不需要坐标轴...但是否则你需要手动进行缩放... - agstudy
好的,虽然我可能会尝试不使用格子来实现 - 我已经做了一些基本的网格处理,应该不难。我不确定如何构造输入数据,有起始人口,然后从这些人口流出 - 也许“宽”格式化的数据框架是最好的选择。如果我理解正确,您的示例具有终点大小,这不能转换为贝塞尔曲线的lwd参数的宽度...在开始开发自己的函数之前,我会在几天内检查您的答案,以确保没有人已经拥有我的梦想功能。 - Max Gordon
1只是想让你知道,我实现了这个想法,可以看看我的答案。有一些细节可能很好,但它完成了我需要的工作。 - Max Gordon
0
虽然这是一篇很老的帖子,但问题的一部分在于术语。一旦你知道该如何称呼某个东西,就更容易弄清楚如何表示数据。这些图表是 桑基图。
我个人喜欢使用 Mike Bostock 的 D3js 库 制作这些图表,但 R 也可以做到。
- user918967
网页内容由stack overflow 提供, 点击上面的可以查看英文原文,
原文链接
原文链接
plotmat满足您在文本中提到的要求。当然,如果您想要花哨形状的箭头等等,您需要修改该函数或编写自己的函数。 - Roland