我想要在一个图形的不同分面上添加面板标签。我希望它们是1:7,但是以下代码似乎没有工作:
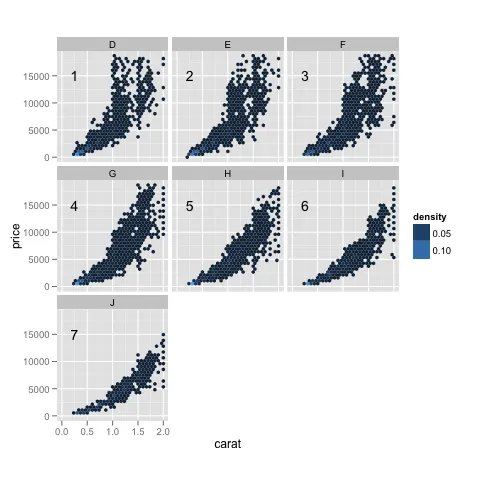
d <- ggplot(diamonds, aes(carat, price, fill = ..density..)) +
     xlim(0, 2) + stat_binhex(na.rm = TRUE) + opts(aspect.ratio = 1)

d1<-d + facet_wrap(~ color)

d1+annotate("text", x=0.25, y=1.5e+04, label=1:7)
Error: When _setting_ aesthetics, they may only take one value. Problems: label
现在,我可以提供一个单一的值,并将其复制到所有维度上。但是如何在使用annotate()时在不同的维度中使用不同的标签?
colnames()与您即将绘制的数据的列名匹配。 - Kots