如何在Lattice bwplot中更改面板标签和x轴子标签

12

我使用RStudio(MacOS)已有2周,如果我忽略了一个能解决我的问题的显而易见的函数,请原谅。
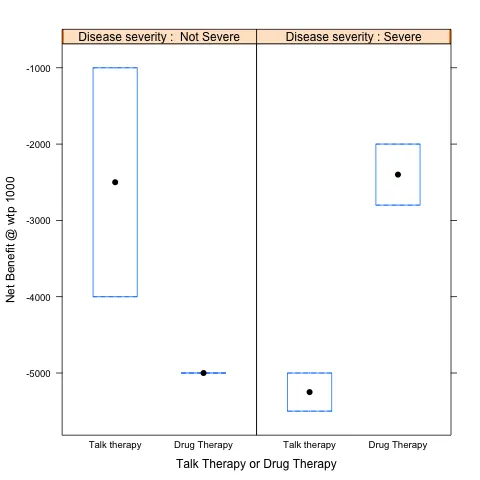
作为一个项目,我试图用4个图表表示净收益来重现一个箱线图,其中x轴标签为疾病类型--“非严重”(0)或“严重”(1),子标签为治疗方法--“谈话疗法”(0)或“药物疗法”(1)。

这是目前我的脚本:

tx <- c(0,0,0,0,1,1,1,1)
dztype <- c(1,0,1,0,0,0,1,1)
NBwtp1000 <- c(-5500,-4000,-5000,-1000,-5000,-5000,-2800,-2000)
require(lattice)
bwplot(NBwtp1000 ~ paste0("Tx ", tx) | paste0("Disease Severity ", dztype),
       xlab="Talk Therapy (Tx 0) or Drug Therapy (Tx 1)", 
       ylab="Net Benefit @ wtp 1000", horizontal=FALSE)

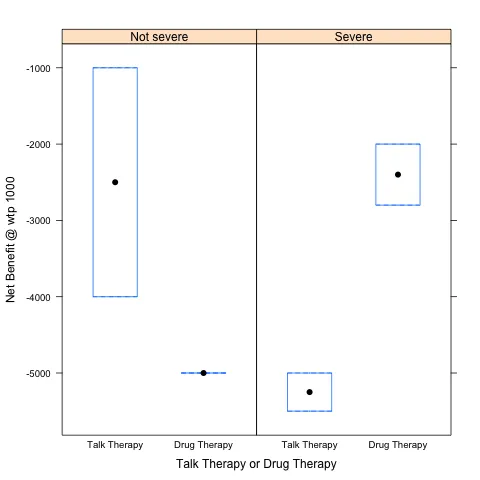
如果你运行这段代码,你会看到箱线图:感谢论坛上一些关于lattice的函数的信息性帖子,我已经接近成功了。

然而,我对结果仍不满意。我使用paste0函数向X轴子标签添加字符串描述符来表示治疗组(最初标记为“1,2”,现在显示为“Tx 0,Tx 1”),但我希望这些子标签分别显示为“Talk Therapy”和“Drug Therapy”。 (我只是不知道如何去除现有的数字标签。)
同样地,我希望面板标签在标签当前为0时显示为“Not Severe”,在标签当前为1时显示为“Severe”。

1个回答

11

据我所见,最简单的方法是将您的txdztype转换为具有适当级别名称的因子。

tx <- factor(tx, levels=c(0,1), labels=c("Talk Therapy", "Drug Therapy"))
dztype <- factor(dztype, levels=c(0,1), labels=c("Not severe", "Severe"))
bwplot(NBwtp1000 ~ tx | dztype, xlab="Talk Therapy or Drug Therapy", 
       ylab="Net Benefit @ wtp 1000", horizontal=FALSE)

在此输入图片描述

另一个解决方案是对 tx 级别使用参数 scale,对 dztype 使用参数 strip:

tx <- c(0,0,0,0,1,1,1,1)
dztype <- c(1,0,1,0,0,0,1,1)
bwplot(NBwtp1000 ~ tx | dztype, xlab="Talk Therapy or Drug Therapy", 
       ylab="Net Benefit @ wtp 1000", horizontal=FALSE,
       scales=list(x=list(labels=c("Talk therapy","Drug Therapy"))), 
       strip=strip.custom(var.name="Disease severity", 
                          factor.levels=c(" Not Severe", "Severe"),
                          strip.levels=rep(TRUE,2)))

输入图像描述


网页内容由stack overflow 提供, 点击上面的
可以查看英文原文,
原文链接