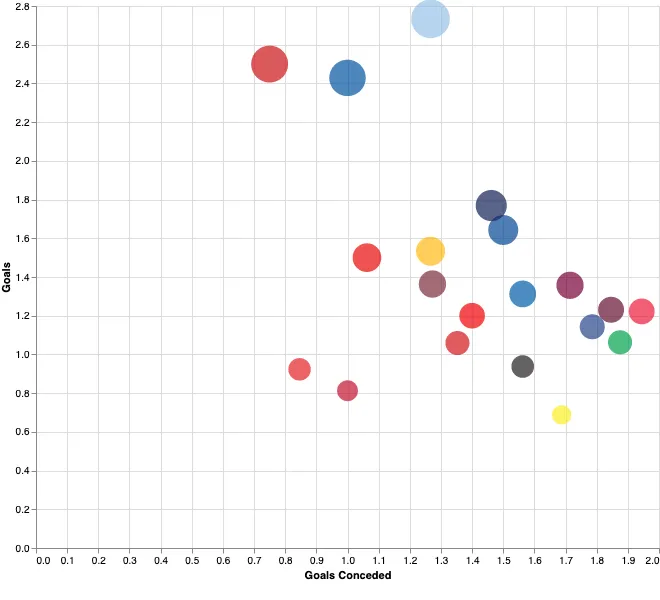
Altair - 在图表中绘制一个x=y的直线

4
这段代码:
chart = alt.Chart(df).mark_point(filled=True).encode(
      alt.X('Goals Conceded:Q'),
      alt.Y('Goals:Q'),
      alt.Size('Goals:Q', legend=None, scale=alt.Scale(range=[0, 1500])),
      alt.Color('Color', legend=None, scale=None),
      tooltip = [alt.Tooltip('For Team:N'),
                alt.Tooltip('Goals:Q'),
                alt.Tooltip('Goals Conceded:Q')]
      ).properties(
          width=800,
          height=600
      )

图表:

输入图片说明

现在,我想手动添加一条线,使得 x = y,以获得以下结果:
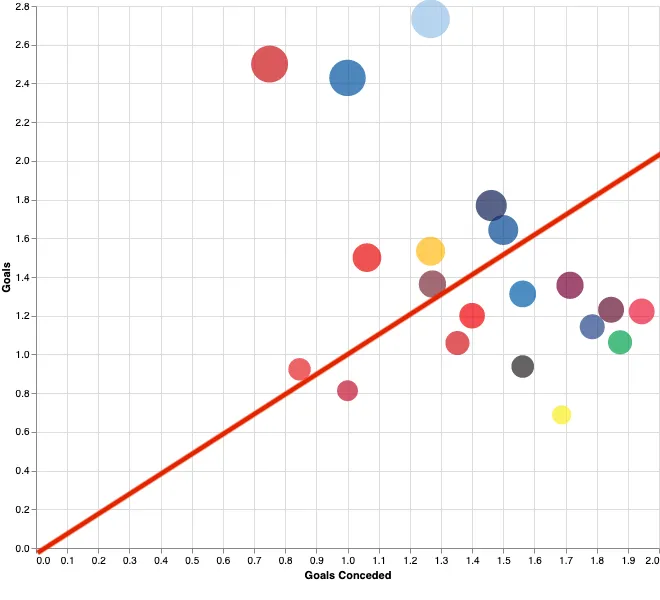
输入图片说明


如何实现这个目标?

1个回答

6
您可以添加一行虚拟代码:
line = pd.DataFrame({
    'Goals Conceded': [0, 2],
    'Goals': [0, 2],
})

line_plot = alt.Chart(line).mark_line(color= 'red').encode(
    x= 'Goals Conceded',
    y= 'Goals'.
)

chart + line_plot

我没有你的数据集,所以以下示例主要借鉴自Altair Example Gallery(Altair示例库)

import pandas as pd
import altair as alt
from vega_datasets import data

source = data.iris()

iris_plot = alt.Chart(source).mark_circle().encode(
    alt.X('sepalLength'),
    alt.Y('sepalWidth'),
    color='species',
    size='petalWidth'
)

line = pd.DataFrame({
    'sepalLength': [0, 5],
    'sepalWidth':  [0, 5],
})

line_plot = alt.Chart(line).mark_line(color= 'red').encode(
    x= 'sepalLength',
    y= 'sepalWidth',
)

iris_plot + line_plot

enter image description here


1
有没有办法在Altair中确定线的域? - RoyalTS

网页内容由stack overflow 提供, 点击上面的
可以查看英文原文,
原文链接