我想使用matplotlib绘制高斯函数。以下是我的代码:
#!/usr/bin/env python
from matplotlib import pyplot as plt
import numpy as np
import math
def gaussian(x, alpha, r):
return 1./(math.sqrt(alpha**math.pi))*np.exp(-alpha*np.power((x - r), 2.))
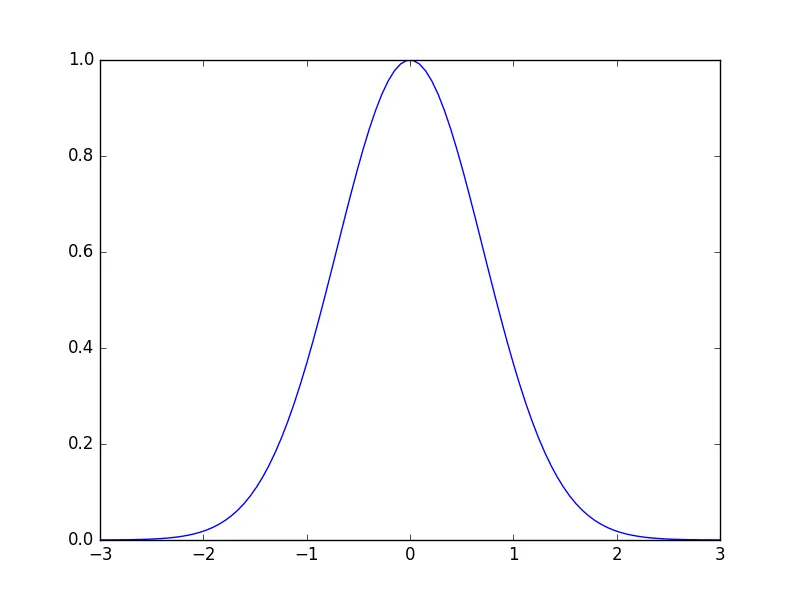
x = np.linspace(-3, 3, 100)
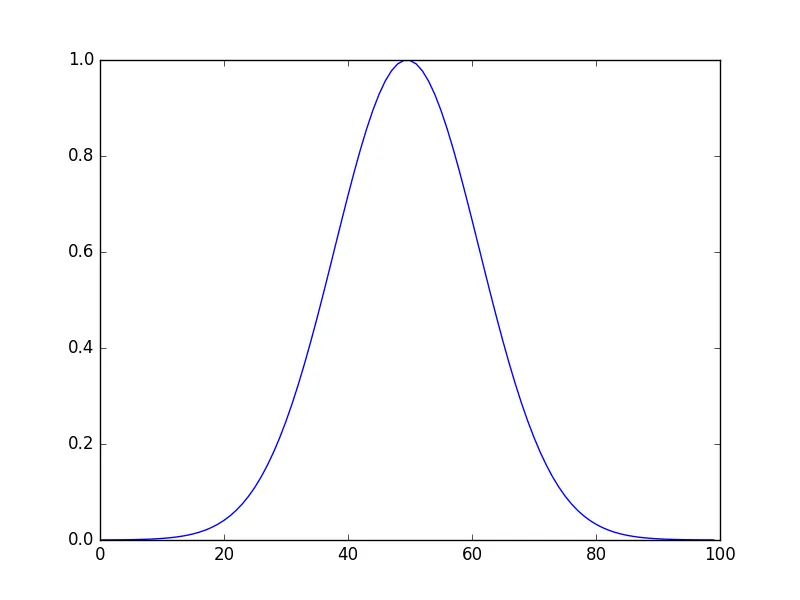
plt.plot(gaussian(x, 1, 0))
plt.show()
为什么范围是从0到100而不是-3到3呢?