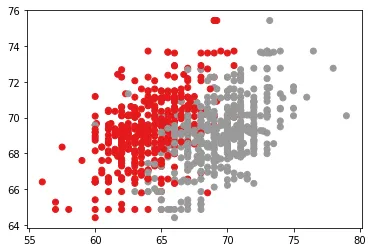
我希望能够使用两个指标[儿童身高,父母身高]来制作散点图,并且要根据性别这个分类变量进行区分。但是,我已经尝试了许多方法来绘制一个具有不同边缘颜色的空心圆。
我已经尝试过以下方法:
plt.scatter(X[:, 0], X[:, 1], c=y, marker = 'o',facecolors='none', cmap=plt.cm.Set1)
但是它只给了我完整的圆圈:
我希望能够使用两个指标[儿童身高,父母身高]来制作散点图,并且要根据性别这个分类变量进行区分。但是,我已经尝试了许多方法来绘制一个具有不同边缘颜色的空心圆。
我已经尝试过以下方法:
plt.scatter(X[:, 0], X[:, 1], c=y, marker = 'o',facecolors='none', cmap=plt.cm.Set1)
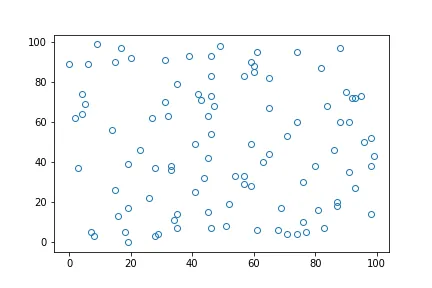
fillstyle = 'none'命令:https://matplotlib.org/gallery/lines_bars_and_markers/marker_fillstyle_reference.html。x = np.random.randint(100, size=100)
y = np.random.randint(100, size=100)
plt.plot(x,y,lw=0, marker='o', fillstyle='none')
plt.show()
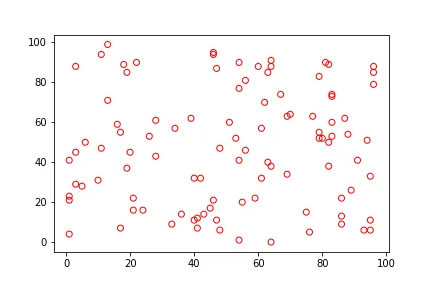
或者,如果你想使用plt.scatter:
plt.scatter(x,y,marker='o', facecolors='none', edgecolors='r')

plt.show()
plt.scatter(X[:, 0], X[:, 1], c=y,marker='o', facecolors='none', edgecolors='r')时,似乎 facecolors 不起作用。圆圈内部的颜色仍然出现。 - Qingc=y并使用edgecolors=y,其中y为不同的颜色。 您可以将它们存储在一个数组中,在if条件下进行处理,例如if y=1 -> color = red; else -> color=gray。 - Alessandro Peca