我如何配置ggplot2阶跃图,以使绘制的值超过某个水平时显示一种颜色,低于该水平时显示另一种颜色?(最终我想指定使用的颜色。)我的第一个想法是这只需要我向现有数据框中添加一列,并将该列映射到geom_step()的aes()上即可解决问题。这在某种程度上起作用:我得到了两种颜色,但它们重叠在一起,如下图所示: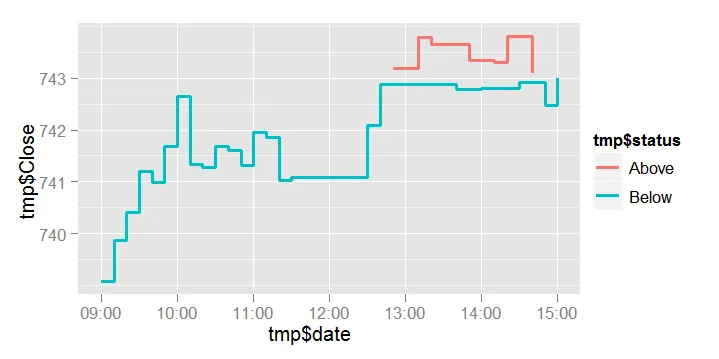 我已经在SO上搜索了几个小时,找到了许多类似但不完全相同的问题。然而,尽管在不同层中尝试了很多组合,我仍然无法解决问题。代码如下。非常感谢任何帮助。
我已经在SO上搜索了几个小时,找到了许多类似但不完全相同的问题。然而,尽管在不同层中尝试了很多组合,我仍然无法解决问题。代码如下。非常感谢任何帮助。require(ggplot2)
tmp <- structure(list(date = structure(c(1325635200, 1325635800, 1325636400,
1325637000, 1325637600, 1325638200, 1325638800, 1325639400, 1325640000,
1325640600, 1325641200, 1325641800, 1325642400, 1325643000, 1325643600,
1325644200, 1325647800, 1325648400, 1325649000, 1325649600, 1325650200,
1325650800, 1325651400, 1325652000, 1325652600, 1325653200, 1325653800,
1325654400, 1325655000, 1325655600, 1325656200, 1325656800), tzone = "", tclass = c("POSIXct",
"POSIXt"), class = c("POSIXct", "POSIXt")), Close = c(739.07,
739.86, 740.41, 741.21, 740.99, 741.69, 742.64, 741.34, 741.28,
741.69, 741.6, 741.32, 741.95, 741.86, 741.02, 741.08, 742.08,
742.88, 743.19, 743.18, 743.78, 743.65, 743.66, 742.78, 743.34,
742.81, 743.31, 743.81, 742.91, 743.09, 742.47, 742.99)), .Names = c("date",
"Close"), row.names = c(NA, -32L), class = "data.frame")
prevclose <- 743
tmp$status <- as.factor(ifelse (tmp$Close> prevclose, "Above", "Below"))
ggplot() +
geom_step(data = tmp,aes(date, Close, colour = status))