R中用于响应面分析的三维散点图

4
我想通过scatterplot3d绘制响应面图,但以下代码会出错。
library(rsm)
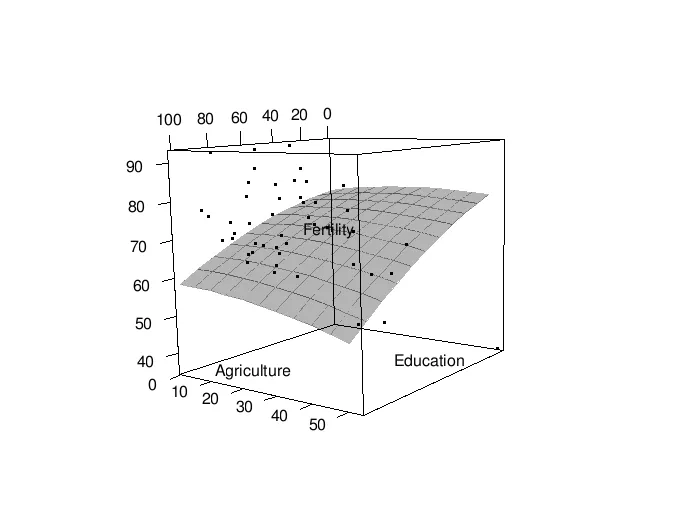
swiss2.lm <- lm(Fertility ~ poly(Agriculture, Education, degree = 2), data = swiss)
persp(swiss2.lm, Education ~ Agriculture, zlab = "Fertility")

library(scatterplot3d)
s3d <- 
  scatterplot3d(
      swiss
   # , type = "h"
    , highlight.3d = TRUE
    , angle = 55
    , scale.y = 0.7
    , pch = 16
     )

s3d$plane3d(swiss2.lm, lty.box = "solid")

如何找出问题所在?
编辑
Error in segments(x, z1, x + y.max * yx.f, z2 + yz.f * y.max, lty = ltya,  : 
  cannot mix zero-length and non-zero-length coordinates

我正在使用rsm库中的swiss数据。

什么错误?你使用的是哪些数据? - Jeff Allen
@JeffAllen:请查看我的编辑。谢谢。 - MYaseen208
@MYaseen208 我不知道这是否有帮助,但如果你使用degree=1运行poly,你就不会出现错误。swiss2.lm <- lm(Fertility ~ poly(Agriculture, Education, degree = 1), data = swiss) - agstudy
感谢@agstudy的评论并对我的问题表示关注。实际上,我需要二次多项式,因此次数应为2。 - MYaseen208
1个回答

6
你对使用scatterplot3d有多依赖?如果你愿意在rgl中使用,那么很容易。根据你的示例:
设置均匀间隔的网格并进行预测:
newdat <- expand.grid(Education=seq(0,50,by=5),
            Agriculture=seq(0,100,by=10))
newdat$pp <- predict(swiss2.lm,newdata=newdat)

绘制点并添加表面:

library(rgl)
with(swiss,plot3d(Agriculture,Education,Fertility))
with(newdat,surface3d(unique(Agriculture),unique(Education),pp,
                      alpha=0.3,front="line"))
rgl.snapshot("swiss.png")

enter image description here

rgl具有一些优点(隐藏线条、光照效果、动态旋转和缩放),也有一些缺点(不适合基础包布局等;更难以操作字体、包括plotmath方程式等;更难以调整标签位置和绘图风格)。car包中的scatter3d函数具有一些很好的功能,可以将回归曲面添加到rgl绘图中,但就我所见,它只能做加性模型,而不能进行二次多项式模型...

就我所知,在scatterplot3d框架中,为了实现这一点,您需要构造与回归曲面上四边形相对应的点,并使用xyz.convertsegments来绘制它们...


网页内容由stack overflow 提供, 点击上面的
可以查看英文原文,
原文链接