将NetworkX节点和边缩放成与邻接矩阵成比例

4
NetworkX是否有内置的方法可以按照邻接矩阵频率/节点-节点频率来缩放节点和边缘的大小? 我正在尝试根据邻接矩阵频率和节点-节点频率来调整节点和文本的大小,以及根据节点-节点频率来调整边缘的权重。我已经为图形创建了一个频率属性,但这并不能解决将信息传递到图形中关于节点-节点频率的问题。
因此,这是一个两部分的问题:
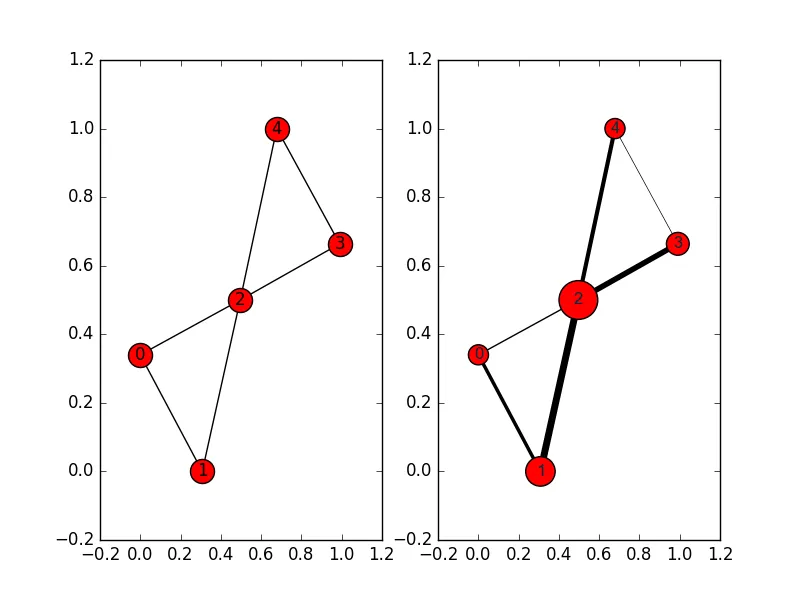
1) 将邻接矩阵转换成NetworkX图的最佳实践是什么?
2) 我如何使用这些信息来缩放节点的大小和边缘的权重?
## Compute Graph (G)
G = nx.Graph(A)

## Add frequency of word as attribute of graph
def Freq_Attribute(G, A):
    frequency = {}  # Dictionary Declaration
    for node in G.nodes():
        frequency[str(node)] = A[str(node)][str(node)]
    return nx.set_node_attributes(G, 'frequency', frequency)

Freq_Attribute(g,A) # Adds attribute frequency to graph, for font scale

## Plot Graph with Labels
plt.figure(1, figsize=(10,10))

# Set location of nodes as the default
pos = nx.spring_layout(G, k=0.50, iterations=30)  

# Nodes
node_size = 10000
nodes1 = nx.draw_networkx_nodes(G,pos,
                       node_color='None',
                       node_size=node_size,
                       alpha=1.0)  # nodelist=[0,1,2,3],
nodes1.set_edgecolor('#A9C1CD') # Set edge color to black

# Edges
edges = nx.draw_networkx_edges(G,pos,width=1,alpha=0.05,edge_color='black')
edges.set_zorder(3)

# Labels
nx.draw_networkx_labels(G,pos,labels=nx.get_node_attributes(G,'label'),
                        font_size=16, 
                        font_color='#062D40',
                        font_family='arial')  # sans-serif, Font=16
# node_labels = nx.get_node_attributes(g, 'name') 
# Use 'g.graph' to find attribute(s): {'name': 'words'}

plt.axis('off')
#plt.show()

我尝试过设置标签的字体大小,但没有成功: font_size = nx.get_node_attributes(G, 'frequency') + 8
1个回答

2
我尝试了以下方法来满足您的需求:
import networkx as nx
import matplotlib.pyplot as plt

## create nx graph from adjacency matrix
def create_graph_from_adj(A):
    # A=[(n1, n2, freq),....]
    G = nx.Graph()
    for a in A:
        G.add_edge(a[0], a[1], freq=a[2])
    return G

A = [(0, 1, 0.5), (1, 2, 1.0), (2, 3, 0.8), (0, 2, 0.2), (3, 4, 0.1), (2, 4, 0.6)]
## Compute Graph (G)
G = create_graph_from_adj(A)

plt.subplot(121)

# Set location of nodes as the default
spring_pose = nx.spring_layout(G, k=0.50, iterations=30)  

nx.draw_networkx(G,pos=spring_pose)


plt.subplot(122)
# Nodes
default_node_size = 300
default_label_size = 12
node_size_by_freq = []
label_size_by_freq = []
for n in G.nodes():
    sum_freq_in = sum([G.edge[n][t]['freq'] for t in G.neighbors(n)])
    node_size_by_freq.append(sum_freq_in*default_node_size)
    label_size_by_freq.append(int(sum_freq_in*default_label_size))

nx.draw_networkx_nodes(G,pos=spring_pose,
                       node_color='red',
                       node_size=node_size_by_freq,
                       alpha=1.0)  
nx.draw_networkx_labels(G,pos=spring_pose,
                        font_size=12,  #label_size_by_freq is not allowed
                        font_color='#062D40',
                        font_family='arial') 

# Edges
default_width = 5.0
edge_width_by_freq = []
for e in G.edges():
    edge_width_by_freq.append(G.edge[e[0]][e[1]]['freq']*default_width)
nx.draw_networkx_edges(G,pos=spring_pose,
                       width=edge_width_by_freq,
                       alpha=1.0,
                       edge_color='black')

plt.show()

enter image description here

首先,邻接反应没有以矩阵格式给出,但在我看来,那太繁琐了。

其次,nx.draw_networkx_labels 不允许标签使用不同的字体大小。这个无法解决。

最后,边缘宽度和节点大小可以进行调整。因此,它们分别基于其频率和入站频率之和进行缩放。

希望这有所帮助。


网页内容由stack overflow 提供, 点击上面的
可以查看英文原文,
原文链接