使用 matplotlib 的 fill_between 函数和两个列表的 where 条件

3

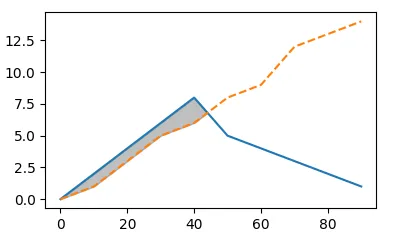
我正在尝试在该示例代码生成的两条曲线相交点之前填充区域。

import numpy as np
import matplotlib.pyplot as plt 

x = np.arange(0,100,10)
y1 = [0,2,4,6,8,5,4,3,2,1]
y2 = [0,1,3,5,6,8,9,12,13,14]

fig = plt.figure()
ax = fig.add_subplot(111)
ax.plot(t_list,y1,linestyle='-')
ax.plot(t_list,y2,linestyle='--')
plt.show()  

仅需使用以下代码:

ax.fill_between(x,y1,y2,where=y1>=y2,color='grey',alpha='0.5')

无法工作,并出现以下错误:“ValueError:参数尺寸不兼容”

我尝试将列表转换为数组:

z1 = np.array(y1)
z2 = np.array(y2)

然后:

ax.fill_between(x,y1,y2,where=z1>=z2,color='grey',alpha='0.5')

并非整个区域都被遮蔽了。

我知道我必须通过插值找到两条曲线的交点,但我还没有看到一个简单的方法来做这件事。

1个回答

阿里云服务器只需要99元/年,新老用户同享,点击查看详情
7

你说得完全正确,你需要进行插值操作。这个过程非常复杂,因为你需要在调用fill_between函数时添加interpolate=True的关键字参数。

ax.fill_between(x,y1,y2,where=z1>=z2,color='grey', interpolate=True)

这里插入图片描述

完整的可复现代码:

import numpy as np
import matplotlib.pyplot as plt 

x = np.arange(0,100,10)
y1 = [0,2,4,6,8,5,4,3,2,1]
y2 = [0,1,3,5,6,8,9,12,13,14]

fig = plt.figure()
ax = fig.add_subplot(111)
ax.plot(x,y1,linestyle='-')
ax.plot(x,y2,linestyle='--')

z1 = np.array(y1)
z2 = np.array(y2)

ax.fill_between(x,y1,y2,where=z1>=z2,color='grey',alpha=0.5, interpolate=True)

plt.show()  

网页内容由stack overflow 提供, 点击上面的
可以查看英文原文,