我们使用运行中位数和中位数绝对偏差进行峰值(和谷值)检测。您可以指定从运行中位数偏离多少被视为峰值。
接下来,我们使用二项模型检查哪些区域包含比预期更多的“极端”值。这个模型(基本上是一个得分测试)会得出“峰值区域”而不是单个峰值。将其反转以获取“谷值区域”很简单。
使用aroma.light软件包中的weightedMedian函数计算运行中位数。我们使用embed()函数创建“窗口”列表并在其上应用核函数。
加权中位数的应用:
center <- apply(embed(tmp,wdw),1,weightedMedian,w=weights,na.rm=T)
这里,tmp是临时数据向量,wdw是窗口大小(必须是奇数)。tmp是通过在数据向量的每一侧添加(wdw-1)/2个NA值来构造的。权重是使用自定义函数构建的。对于mad,我们使用相同的过程,但是在数据本身上进行diff(data)。
运行示例代码:
require(aroma.light)
make.weights <- function(n,
type=c("gaussian","epanechnikov","biweight","triweight","cosinus")){
type <- match.arg(type)
x <- seq(-1,1,length.out=n)
out <-switch(type,
gaussian=(1/sqrt(2*pi)*exp(-0.5*(3*x)^2)),
epanechnikov=0.75*(1-x^2),
biweight=15/16*(1-x^2)^2,
triweight=35/32*(1-x^2)^3,
cosinus=pi/4*cos(x*pi/2),
)
out <- out/sum(out)*n
return(out)
}
score.test <- function(x,p0,w){
n <- length(x)
if(missing(w)) w<-rep(1,n)
w <- w[!is.na(x)]
x <- x[!is.na(x)]
if(sum(w)!=n) w <- w/sum(w)*n
phat <- sum(x*w)/n
z <- (phat-p0)/sqrt(p0*(1-p0)/n)
p <- 1-pnorm(z)
return(p)
}
embed.na <- function(x,n){
extra <- rep(NA,n)
x <- c(extra,x,extra)
out <- embed(x,2*n+1)
return(out)
}
running.score <- function(sel,n=20,w,p0){
if(missing(w)) w<- rep(1,2*n+1)
if(missing(p0))p0 <- sum(sel,na.rm=T)/length(sel[!is.na(sel)])
out <- apply(embed.na(sel,n),1,score.test,p0=p0,w=w)
return(out)
}
running.med <- function(x,w,n,cte=1.4826){
wdw <- 2*n+1
if(missing(w)) w <- rep(1,wdw)
center <- apply(embed.na(x,n),1,weightedMedian,w=w,na.rm=T)
mad <- median(abs(x-center))*cte
return(list(med=center,mad=mad))
}
set.seed(100)
n = 1000
series <- diffinv(rnorm(20000),lag=1)
peaks <- apply(embed.na(series,n),1,function(x) x[n+1] < quantile(x,probs=0.05,na.rm=T))
pweight <- make.weights(0.2*n+1)
p.val <- running.score(peaks,n=n/10,w=pweight)
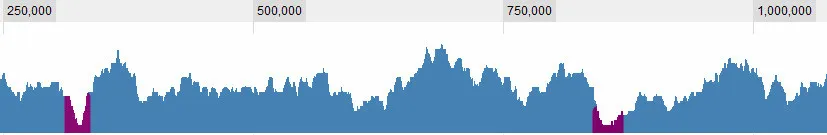
plot(series,type="l")
points((1:length(series))[p.val<0.05],series[p.val<0.05],col="red")
points((1:length(series))[peaks],series[peaks],col="blue")
上面的示例代码是用来查找具有大波动而不是低谷的区域的。我进行了一些调整,但并不是最优解。此外,对于超过20000个值的系列,您需要大量的内存,我不能在我的电脑上运行它。
或者,您可以使用数值导数和二阶导数的近似值来定义低谷。在您的情况下,这可能会更好。计算导数和第一导数的极小值/极大值的实用方法:
f.deriv <- diff(lowess(series,f=n/length(series),delta=1)$y)
f.sec.deriv <- diff(f.deriv)
minmax <- cumsum(rle(sign(f.sec.deriv))$lengths)
op <- par(mfrow=c(2,1))
plot(series,type="l")
plot(f.deriv,type="l")
points((1:length(f.deriv))[minmax],f.deriv[minmax],col="red")
par(op)
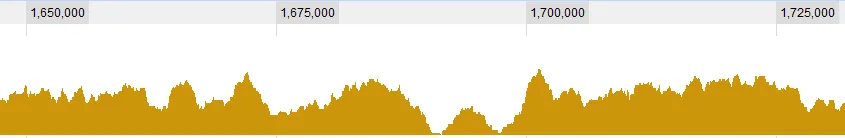
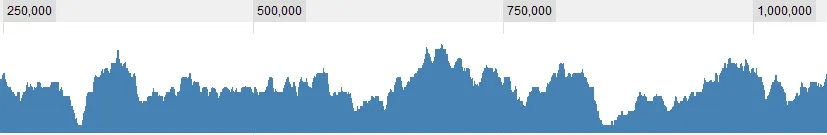 我想在这些数据中寻找“山谷”,也就是显著低于周围环境的区域。
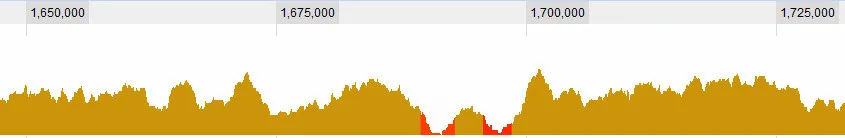
 您有什么建议使用哪些模式来查找这些山谷?我主要使用Perl和R编程。