我已经进行了相当多的搜索,正在尝试做以下事情。我有一个条形图,每个值有两个闪避的条形。每个条形代表一个百分比。(大致如此,因为我还不能发布图片)
Feature |XXXXXXXXXXXXXX  %50
        |XXXXXXXX        %25
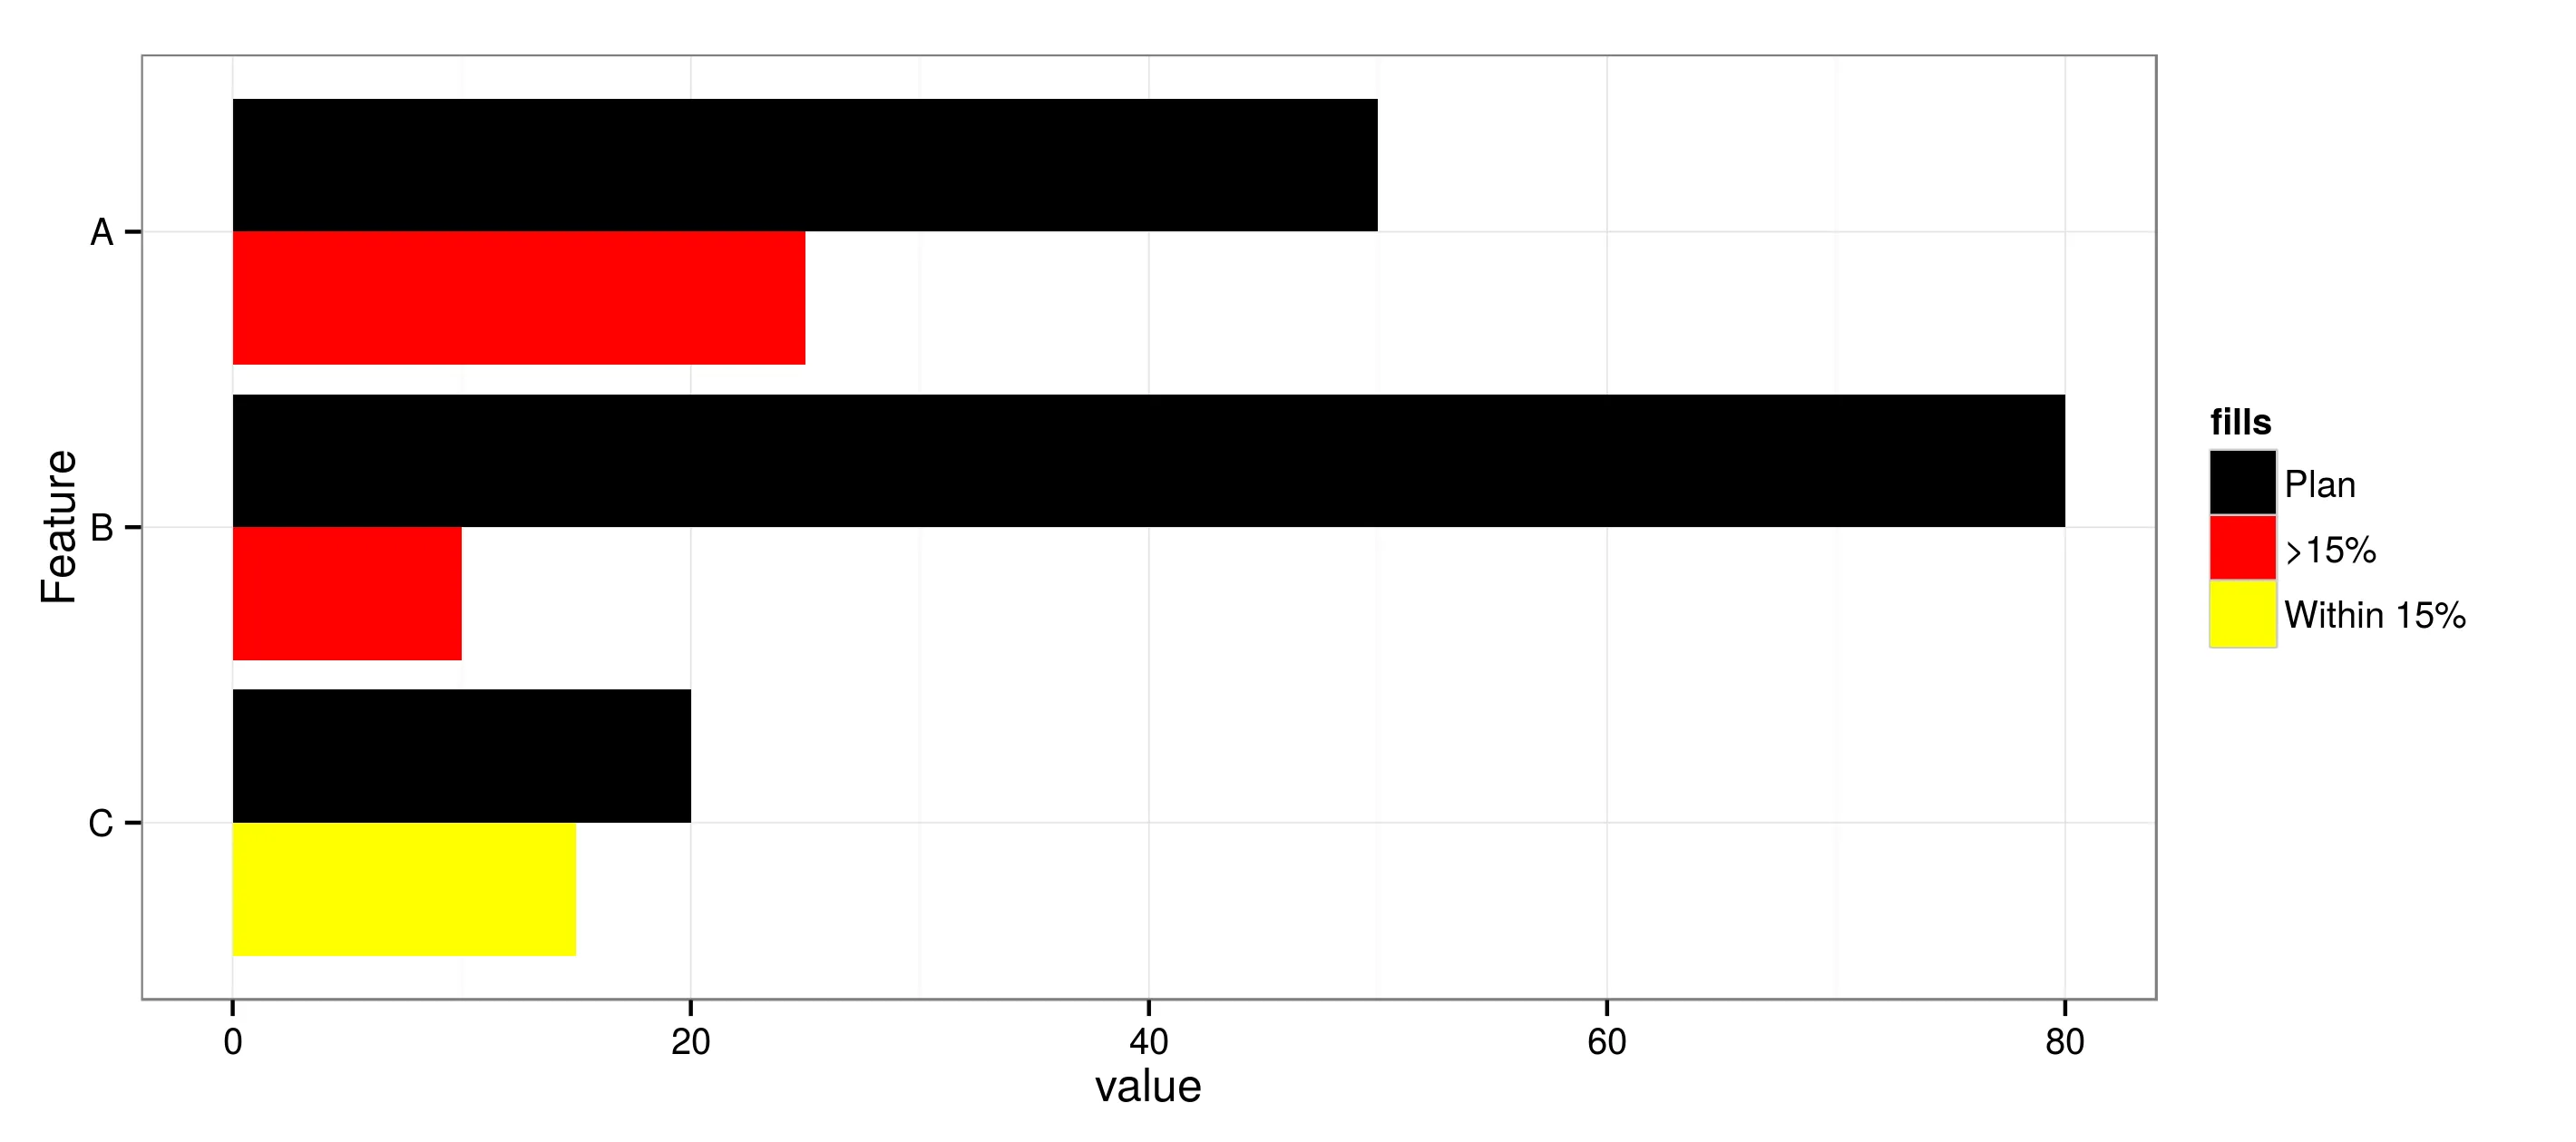
我希望的是,当百分比差异大于15%时,将其中一个柱子的颜色更改为“红色”。以下是我使用的数据:
Feature variable          value
A       "Percent Done"    50
B       "Planned"         25
A       "Percent Done"    10
B       "Planned"         80
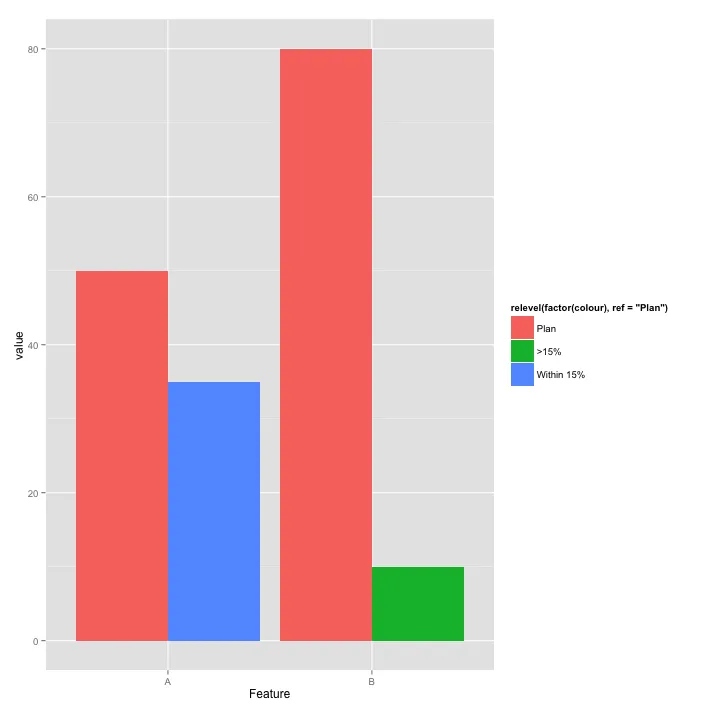
代码:
p3 <- ggplot(plotdata, aes(x = Feature, y = value, fill = variable))
p3 <- p3 + geom_bar( position ="dodge", stat ="identity")+
      coord_flip() + theme_minimal()
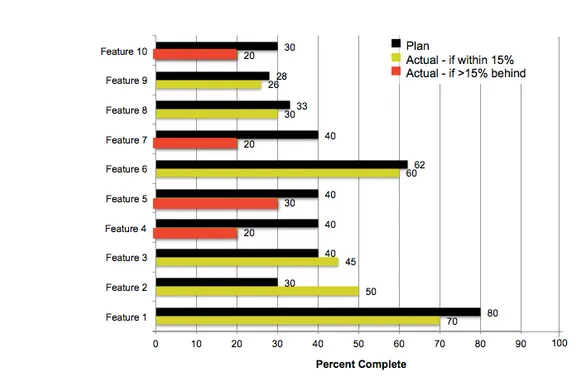
基本上,如果我们看一下顶部的“模拟”,因为两个条之间的百分比大于15%,我希望其中一个条是不同的颜色(第三种颜色),如下所示:
我考虑使用ifelse来设置颜色,但是我还没有能够实现它。我的想法是使用ifelse来返回我想要使用的颜色。所以,如果两个条之间的差异> 15,则返回这种颜色,否则返回另一种颜色。有人知道这是否可能吗?
aes设置为aes(fill = percentage > 15)。 - drmariodcolor=value <= 15来根据百分比改变geom_bar的轮廓。 - drmariod