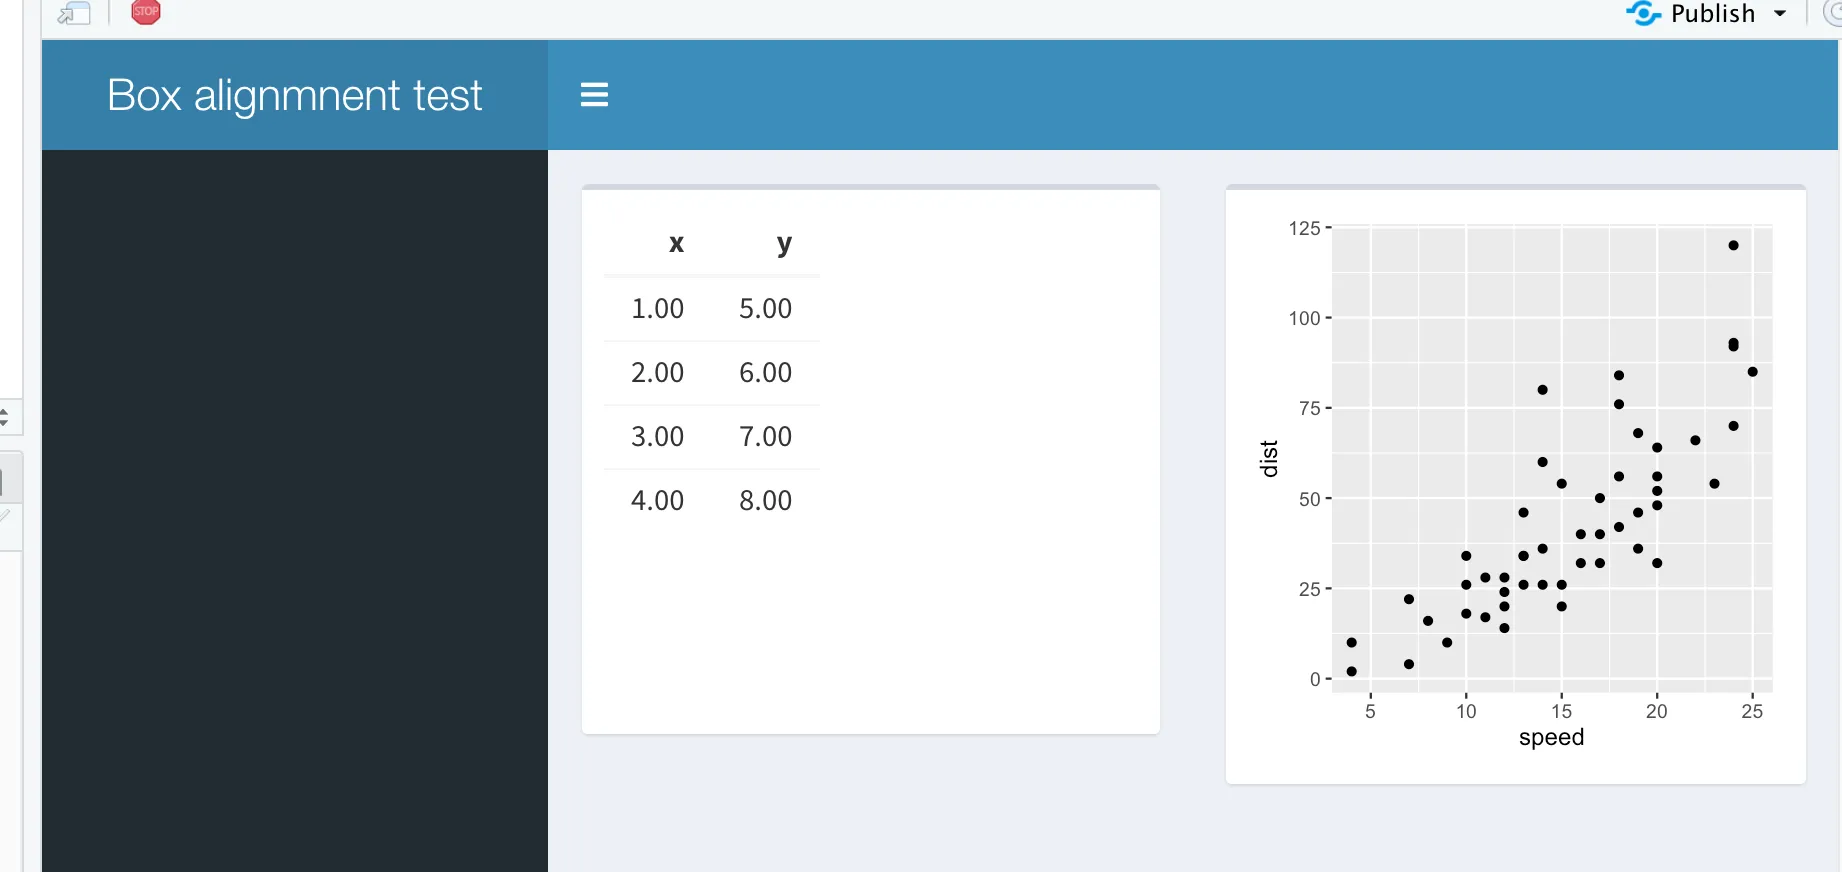
创建Shiny仪表板时,我认为如果盒子的高度相等,它们的顶部和底部会对齐。但事实并非如此。这里顶部很好地对齐,而底部则不对齐:
注意:即使两个框中都填充了完全相同的ggplot,底部的相同不对齐也会发生。
这些说明表明这很容易实现。
引用:
可以通过设置高度来强制所有框的高度相同。与使用12宽Bootstrap网格设置宽度不同,高度以像素为单位指定。
示例代码
注意:即使两个框中都填充了完全相同的ggplot,底部的相同不对齐也会发生。
这些说明表明这很容易实现。
引用:
可以通过设置高度来强制所有框的高度相同。与使用12宽Bootstrap网格设置宽度不同,高度以像素为单位指定。
示例代码
## app.R ##
library(shiny)
library(shinydashboard)
library(ggplot2)

ui <- dashboardPage(
  dashboardHeader(title = "Box alignmnent test"),
  dashboardSidebar(),
  dashboardBody(
    # Put boxes in a row
    fluidRow(
      box(tableOutput("pop_num"), height = 350),
      box(plotOutput("speed_distbn", height = 350))
    )
  )
)

server <- function(input, output) {

  # Population numbers
  output$pop_num <- renderTable({
    df <- tibble(
      x = c(1,2,3,4),
      y = c(5, 6, 7, 8)
    )
  })


  # Population distribution graph
  output$speed_distbn <- renderPlot({
    ggplot(data = cars, aes(x = speed, y = dist)) +
      geom_point()
  })
}

shinyApp(ui, server)