如何让Leaflet在R中使用时占用Shiny仪表板的100%高度

69
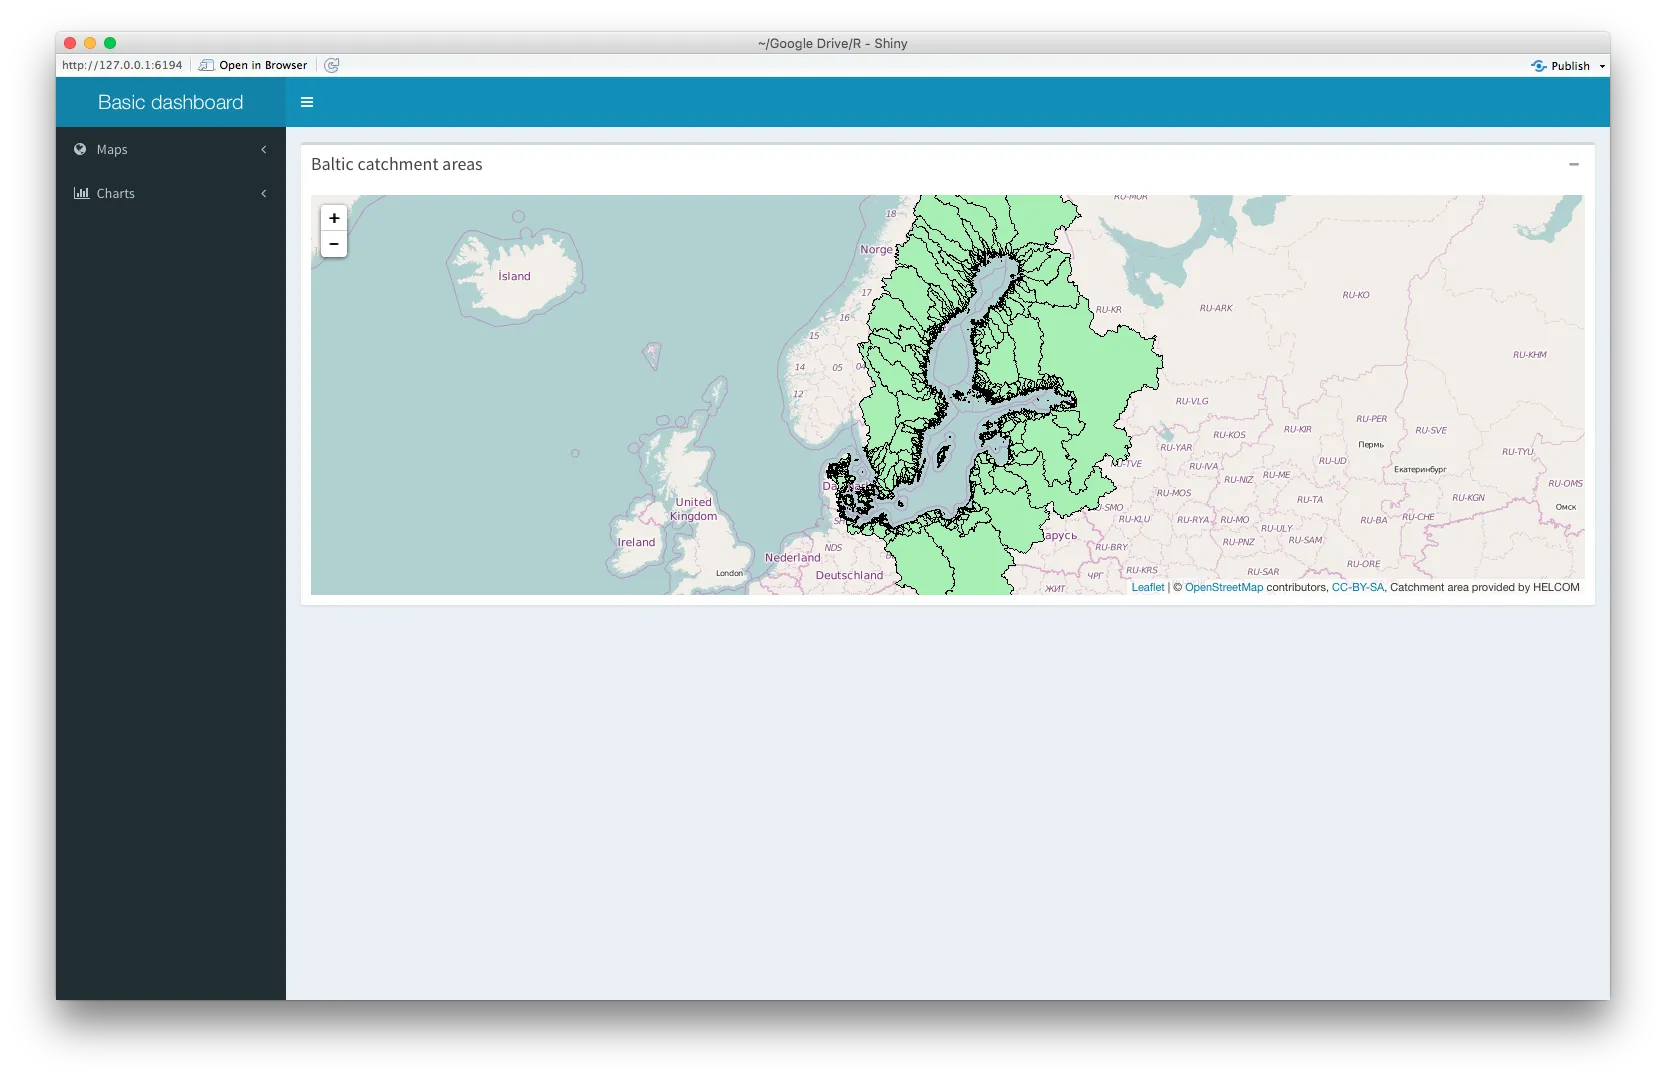
我正在创建一个Shiny仪表板应用程序,其中仪表板主体应显示一些地图。到目前为止,没有问题可以使地图扩展到整个主体的宽度,但它似乎不愿意调整到完整的高度。 enter image description here Leaflet本身已经设置为覆盖100%的高度,但它并不能起到作用。一旦我使用leafletOutput的高度属性,leaflet对象将不会显示,我只剩下一个空框。
以下是代码:
library(shinydashboard)
library(leaflet)

ui <- dashboardPage(
  dashboardHeader(title = "Basic dashboard"),
  dashboardSidebar(
    sidebarMenu(
      menuItem(
        "Maps", 
        tabName = "maps", 
        icon = icon("globe"),
        menuSubItem("Watersheds", tabName = "m_water", icon = icon("map")),
        menuSubItem("Population", tabName = "m_pop", icon = icon("map"))
      ),
      menuItem(
        "Charts", 
        tabName = "charts", 
        icon = icon("bar-chart"),
        menuSubItem("Watersheds", tabName = "c_water", icon = icon("area-chart")),
        menuSubItem("Population", tabName = "c_pop", icon = icon("area-chart"))
      )
    )
  ),
  dashboardBody(
    tabItems(
      tabItem(
        tabName = "m_water",
        box(
          title = "Baltic catchment areas",
          collapsible = TRUE,
          width = "100%",
          height = "100%",
          leafletOutput("l_watershed")
        )
      ),
      tabItem(
        tabName = "m_pop",
        # Map in Dashboard
        leafletOutput("l_population")
      ),
      tabItem(
        tabName = "charts",
        h2("Second tab content")
      )
    )
  )
)

server <- function(input, output) {
  set.seed(122)
  histdata <- rnorm(500)

  output$l_watershed <- renderLeaflet({
    leaflet(height = "100%") %>% addTiles() %>% setView(19.08, 60.25, zoom = 4) %>%addWMSTiles(
      "http://62.236.121.188/arcgis/services/DataAndMaps/Background/MapServer/WMSServer?",
      layers = "11",
      options = WMSTileOptions(
        format = "image/png",
        transparent = TRUE
      ),
      attribution = "Catchment area provided by HELCOM"
    )
  })

  output$l_population <- renderLeaflet({
    leaflet(height = "100%") %>% addTiles() %>% setView(19.08, 60.25, zoom = 4) %>%addWMSTiles(
      "http://62.236.121.188/arcgis/services/DataAndMaps/Background/MapServer/WMSServer?",
      layers = "17",
      options = WMSTileOptions(
        format = "image/png",
        transparent = TRUE
      ),
      attribution = "Population data provided by HELCOM"
    )
  })
}

shinyApp(ui, server)
8个回答

107

我个人发现,将高度设置为相对于窗口大小更加令人满意。因为dashboardBody的高度未定义,所以百分比高度无效。但是相对整个文档的高度是可以的。

100%的dashboardBody使得100vh(css3单位)减去标题(最小50像素)减去dashboardBody填充(2 * 15像素)。

因此,将高度设置为100vh-80px,应该就可以了。

由于shiny不支持css3单位,所以必须直接将其包含在文档中,就像下面的代码一样。

library(shiny)
library(shinydashboard)
library(leaflet)

ui <- dashboardPage(
  dashboardHeader(),
  dashboardSidebar(),
  dashboardBody(
    tags$style(type = "text/css", "#map {height: calc(100vh - 80px) !important;}"),
    leafletOutput("map")
  )
)

server <- function(input, output) {
  output$map <- renderLeaflet({
    leaflet() %>% addTiles() %>% setView(42, 16, 4)
  })
}

runApp(shinyApp(ui, server), launch.browser = TRUE)

玩得开心!


21
您可以直接在输出中使用视口高度(vh):leafletOutput("map", height = "95vh")。 - camnesia
不要忘记,如果你的leaflet地图是从输出函数中获取的,请将#map更改为shiny输出变量名称。 - nkorf

12

另一种选择是由jcheng5kent37GitHub上描述的方法。

output$mymap = renderLeaflet({...make a map...})
leafletOutput('mymap', height=1000)

在R flexdashboard中使用leaflet地图对我来说有效。


5
尝试手动添加像素尺寸:
...
  dashboardBody(
    tabItems(
      tabItem(
        tabName = "m_water",
        box(
          title = "Baltic catchment areas",
          collapsible = TRUE,
          width = "100%",
          height = "1000px",
          leafletOutput("l_watershed",width="100%",height="1000px")
        )
      ),
      tabItem(
        tabName = "m_pop",
        # Map in Dashboard
        leafletOutput("l_population",width="100%",height="1000px")
      ),
      tabItem(
        tabName = "charts",
        h2("Second tab content")
      )
    )
  )
...

2
或者在 Box 中,您可以使用 tags$style(type = "text/css", ".box-body {height:80vh}"),然后使用 leafletOutput("l_watershed",width="100%",height="100%") - Batanichek
添加像素大小可以工作... 但是高度取决于用户的屏幕,并且不能设置为固定值。因此,需要使用百分比。有可能完成这个任务吗? - TomGeo
使用 tags$style(type = "text/css", ".box-body {height:80vh}") 能够帮助并提供解决方案!谢谢 - TomGeo
@ThomasBecker 80vh不是完全正确的,它只是屏幕的80%。所以也许@K.Rohde的版本会更好。 - Batanichek
是的,@K. Rohde的版本是更精确的方式。不过,你们两位的回答都回答了问题并解决了问题。 - TomGeo

1

vh单位在一些旧的移动浏览器上无法正常工作。下面的CSS应该适用于计算机和移动设备。

/* for computer */
div.outer {
     height: calc(100vh - 80px);
     padding: 0;
     margin: 0;
     min-height: 500px
}

@media all and (max-width:768px){
/* for mobile */
div.outer  {
  position: fixed;
  top: 70px;
  left: 0;
  right: 0;
  bottom: 0;
  overflow: hidden;
  padding: 0;
}
}

1
您也可以这样做,如果您想将leaflet地图与其他面板结构(如navBarPage)组合在一起,包括在tabPanel中: tags$style(type = "text/css", "html, body {width:100%;height:100%}"), tags$style(type = "text/css", "#map {height: calc(100vh - 80px) !important;}"), leafletOutput("map", width = "100%", height = "100%"),
请注意,以上代码不需要进行解释,保留HTML标签即可。

capture of a navBarPage combined with a leaflet map


1

简而言之:使用单位vh而非%

视口高度(vh)是窗口占用的百分比。
因此,这将垂直填充整个屏幕:
leafletOutput(<tag>, height='100vh')

(避免在renderLeafletleaflet中更改高度)


0
这是对K. Rohde上面答案的变化,它包括相同的方法,但使用shiny模块。请注意,在tag$style行中添加命名空间调用以实现相同的结果。
library(shiny)
library(shinydashboard)
library(leaflet)


mod_leaflet_ui <- function(id){
  ns <- NS(id)
  fillPage(
  tags$style(type = "text/css", paste0("#",ns('map')), "{height: calc(100vh - 80px) !important;}"),
  leafletOutput(ns("map"))
  )
}

mod_leaflet_server <- function(id){
  moduleServer(
    id,
    function(input, output, session) {
      ns <- session$ns
      output$map <- renderLeaflet({
        leaflet() %>% addTiles() %>% setView(42, 16, 4)
        
    })
    
    }

  )
}

ui <- dashboardPage(
  dashboardHeader(),
  dashboardSidebar(),
  dashboardBody(
    mod_leaflet_ui("leaflet_1")
    
  )
)

server <- function(input, output) {
 
  mod_leaflet_server("leaflet_1")
  
}

runApp(shinyApp(ui, server), launch.browser = TRUE)

0

在@K.Rohde的回答基础上,我一直在使用包含自定义CSS文件的文件

#map {
    height: calc(100vh - 130px) !important;
}

@media only screen and (min-width: 768px) {
    #map {
    height: calc(100vh - 80px) !important;
    }
}

网页内容由stack overflow 提供, 点击上面的
可以查看英文原文,
原文链接